
Malta Property to Let - Q4 2016 vs Q1 2017 In-depth Analysis
In this report we will analyse property for rent in Malta to compute and visualise statistics such as average prices, by property type, town and region. Property price trends are also determined by comparing two datasets, collected four months apart.
Data Collection
The property for rent data was collected by scraping publicly available information from a leading real estate agency in Malta. To determine property price trends, two datasets were collected four months apart, one in November 2016 and another in March 2017.
The data collected was further processed to remove data inconsistencies and missing data. To remove noisy data points for which we do not have enough data to compute meaningful statistics, we removed properties from towns if there were less than three properties of that type in a particular town.
Dataset Statistics
from __future__ import division

%matplotlib inline
import matplotlib.pyplot as plt

from IPython.display import set_matplotlib_formats

import numpy
import pandas
import seaborn
import textwrap

# set some CSS styles to customize display of pandas Dataframes as tables.
from IPython.display import HTML, display
display(HTML('''<style>
                    .hide_side_header thead tr th:first-child {visibility:hidden;}
                    .hide_side_header tbody tr th {visibility:hidden;}
                    .right_aligned td { text-align: right; }
                </style>'''))

# set overall font scale to use in charts
seaborn.set(font_scale=1.5);
seaborn.set_style("whitegrid");

# lambda function used in dataframe to html formatters
lambda_format_thousands = lambda x: '{:,.2f}'.format(x)

def wrap_labels(axis, x_axis=True):
    if x_axis:
        tick_labels = axis.get_xticklabels();
    else:
        tick_labels = axis.get_yticklabels();

    wrapper = textwrap.TextWrapper()
    wrapper.width = 7
    wrapper.break_long_words = False

    tick_labels = [l.get_text().title() for l in tick_labels]
    tick_labels = ['\n'.join(wrapper.wrap(l)) for l in tick_labels]

    if x_axis:
        axis.set_xticklabels(tick_labels)
    else:
        axis.set_yticklabels(tick_labels)

def plot_chart_helper(x_field_label, y_field_label, chart_title, chart_data, axes):
    '''
    Small helper to plot seaborn.barplot.
    '''
    seaborn.set_style('whitegrid');
    seaborn.barplot(x=x_field_label, y=y_field_label, data=chart_data, palette="BuGn_d", ax=axes);
    axes.set_ylabel(y_field_label);
    axes.set_xlabel(x_field_label);
    axes.set_title(chart_title);
    wrap_labels(axes);

property_set1 = pandas.read_csv('/home/jovyan/work/machine learning/ds/projects/property-analysis/webapp/pa-api/v1.0/data/malta/mt01/rent/20161118223018/clean_data.csv')
property_set2 = pandas.read_csv('/home/jovyan/work/machine learning/ds/projects/property-analysis/webapp/pa-api/v1.0/data/malta/mt01/rent/20170314141115/clean_data.csv')

# title case locations
property_set1['location'] = property_set1['location'].str.title()
property_set2['location'] = property_set2['location'].str.title()

num_properties_in_set1 = len(property_set1)
num_properties_in_set2 = len(property_set2)
difference_in_properties = num_properties_in_set1 - num_properties_in_set2

print "Q4 2016: {0} properties".format(num_properties_in_set1)
print "Q1 2017: {0} properties".format(num_properties_in_set2)

if difference_in_properties < 0:
    print "Latest data set has {0} properties more than the previous data set - ({1:.1f}%).".format(
          abs(difference_in_properties),(abs(difference_in_properties)/num_properties_in_set2)*100)
elif difference_in_properties > 0:
    print "Previous data set has {0} properties more than the latest data set - ({1:.1f}%).".format(
          abs(difference_in_properties),(abs(difference_in_properties)/num_properties_in_set1)*100)
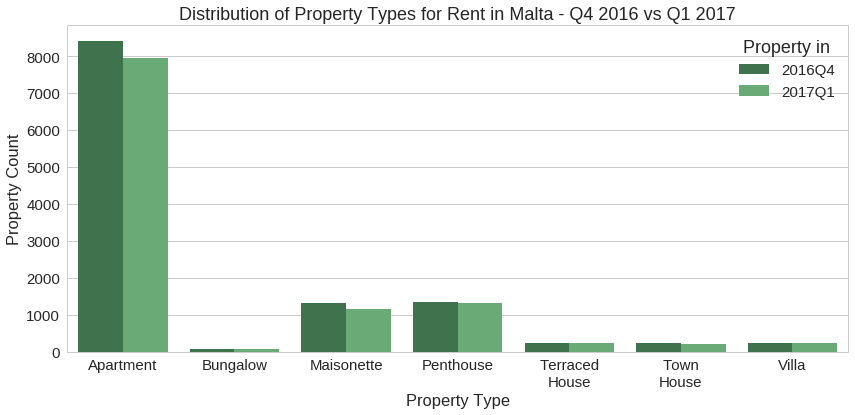
Q4 2016: 11835 properties
Q1 2017: 11171 properties
Previous data set has 664 properties more than the latest data set - (5.6%).
property_set1['dataset_id'] = '2016Q4'
property_set2['dataset_id'] = '2017Q1'
both_property_sets = pandas.concat([property_set1, property_set2])

f, (ax1) = plt.subplots(1, 1, figsize=(14, 6))
both_property_sets.sort_values(by=['dataset_id','property_type'], inplace=True)
seaborn.countplot(x='property_type', hue='dataset_id', data=both_property_sets, palette="Greens_d", ax=ax1);
ax1.set_xlabel('Property Type');
ax1.set_ylabel('Property Count');
ax1.legend(title="Property in")
ax1.set_title('Distribution of Property Types for Rent in Malta - Q4 2016 vs Q1 2017');
wrap_labels(ax1)
Notes
-
We have no way to validate the prices at which properties are listed for rent. These can vary from the actual monthly rent for various reasons, however, we feel that the data still gives a fair view of current market trends.
-
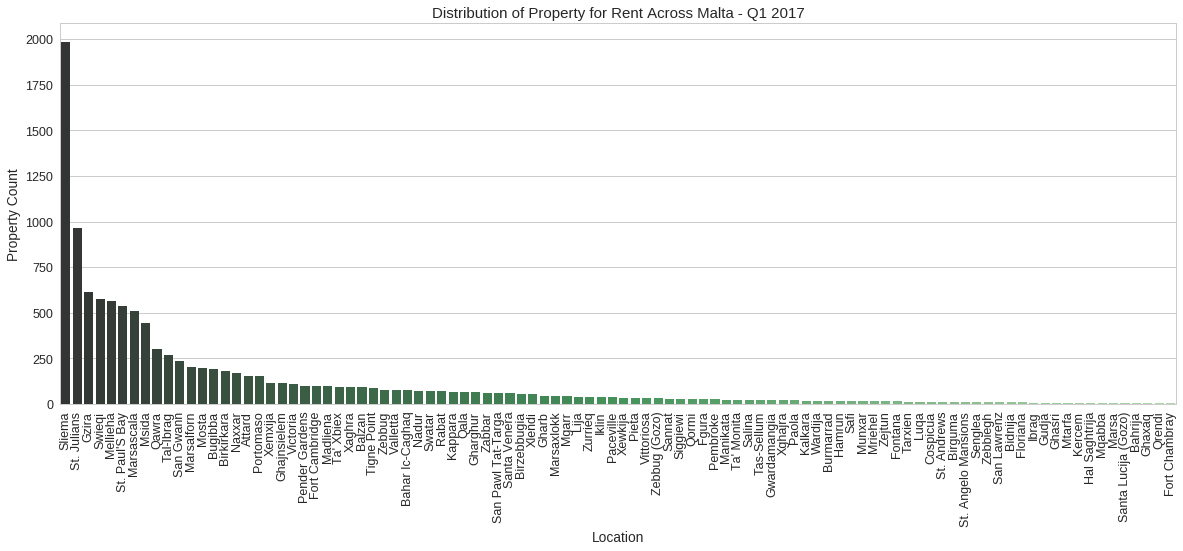
Since the data was collected from one real estate agent’s publicly available records it might not be representative of the overall property market. Nonetheless, in the dataset we have found a good quantity of properties spread out all over the islands, refer to distribution charts by location below, and so think the data is representative enough.
-
Finally, the estate agency selected is not in the business of promoting high end exclusive properties only and so the rental price ranges for all property types are well represented.
Distribution of Property in Malta
seaborn.set(font_scale=1.25);
seaborn.set_style('whitegrid');

f, (ax1) = plt.subplots(1, 1, figsize=(20,7))
location_order = property_set2.groupby('location').count().sort_values(by='price', ascending=False).index.values
seaborn.countplot(x="location", data=property_set2, order=location_order, palette="Greens_d", ax=ax1);
ax1.set_xlabel('Location');
ax1.set_ylabel('Property Count');
ax1.set_title('Distribution of Property for Rent Across Malta - Q1 2017');
plt.setp(ax1.get_xticklabels(), rotation=90);

seaborn.set(font_scale=1.5);
def plot_top_availability_towns(property_type, num_towns=10):
    property_type_list = ['apartment','penthouse','maisonette','town house',
                          'terraced house','villa','bungalow']
    if property_type not in property_type_list:
        print "property_type must be one of {0}.".format(property_type_list)
        return

    seaborn.set_style('whitegrid');
    f, (ax1) = plt.subplots(1, 1, figsize=(20,7))
    filtered_data = property_set2[property_set2['property_type'] == property_type]
    filtered_data = filtered_data.drop(['beds','baths','property_type','status','type','dataset_id'], 1)
    filtered_data = filtered_data.rename(columns = {'price':'count'})
    filtered_data = filtered_data.groupby('location', as_index=False).count().sort_values(by='count', ascending=False)
    seaborn.barplot(x="location", y='count', data=filtered_data.head(n=num_towns), palette="Greens_d", ax=ax1);
    ax1.set_xlabel('Location');
    ax1.set_ylabel('Property Count');
    ax1.set_title('Top {0} Towns for {1}s for Rent - Q1 2017'.format(num_towns, property_type.title()));
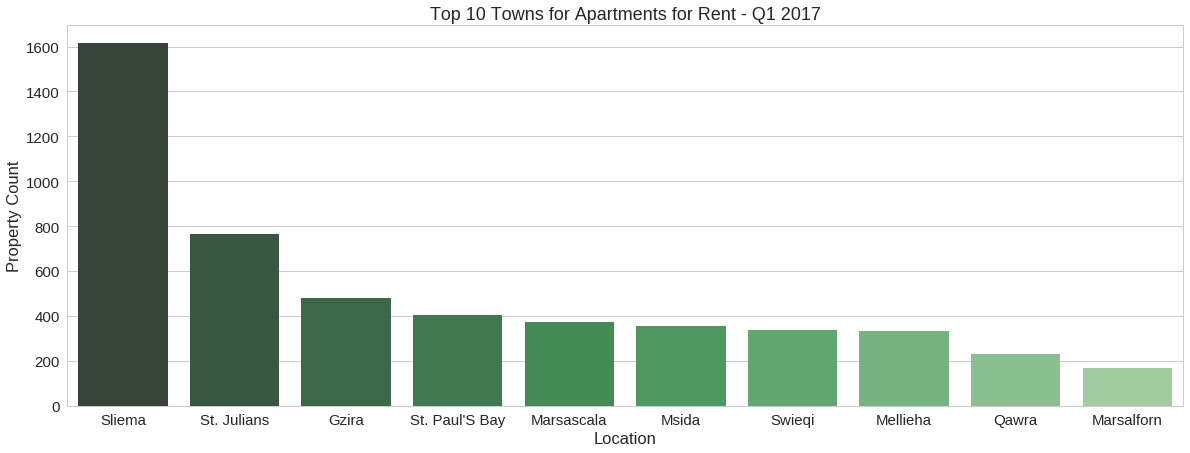
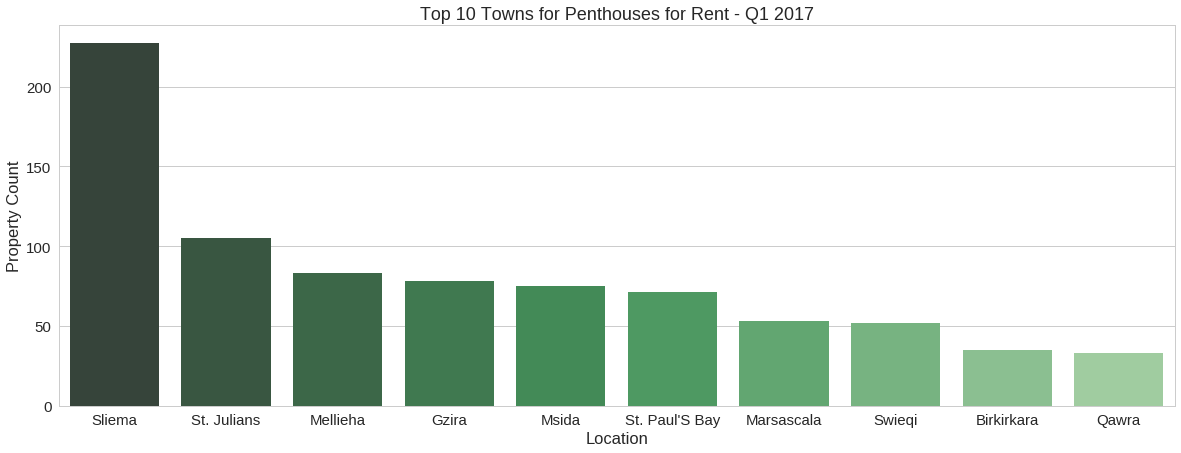
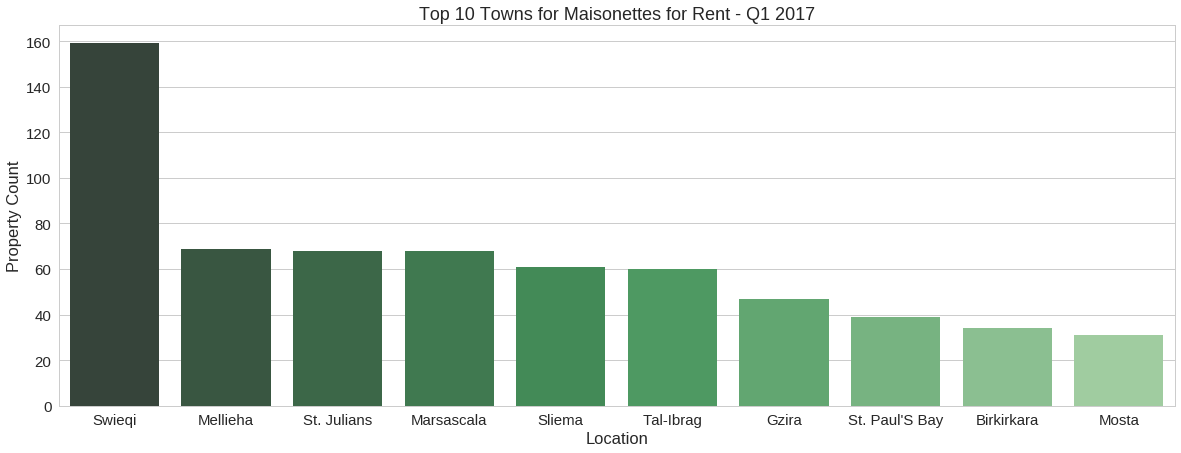
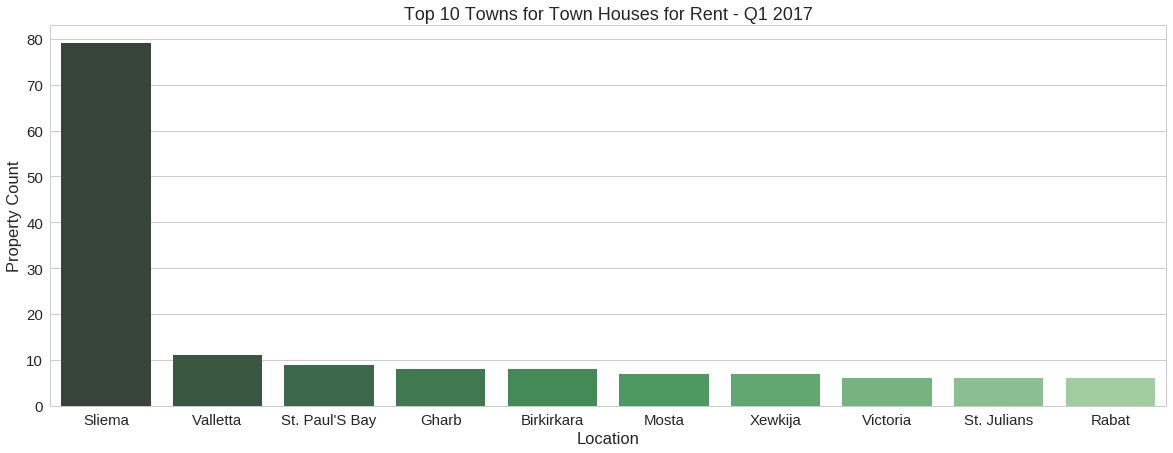
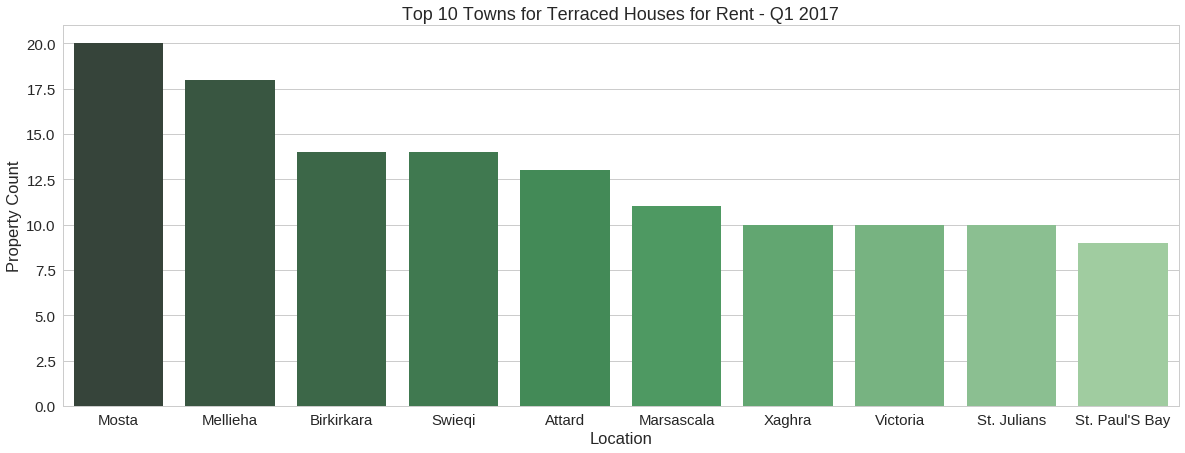
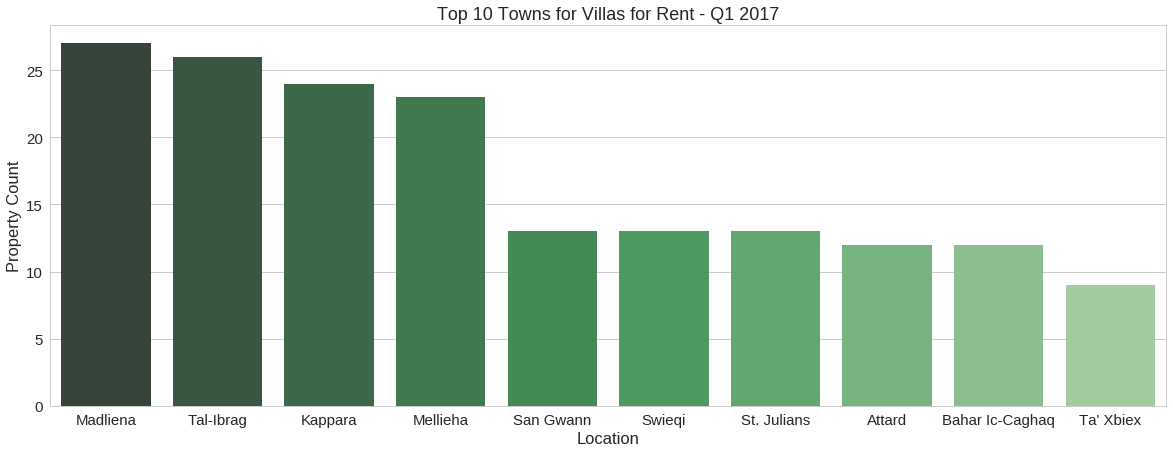
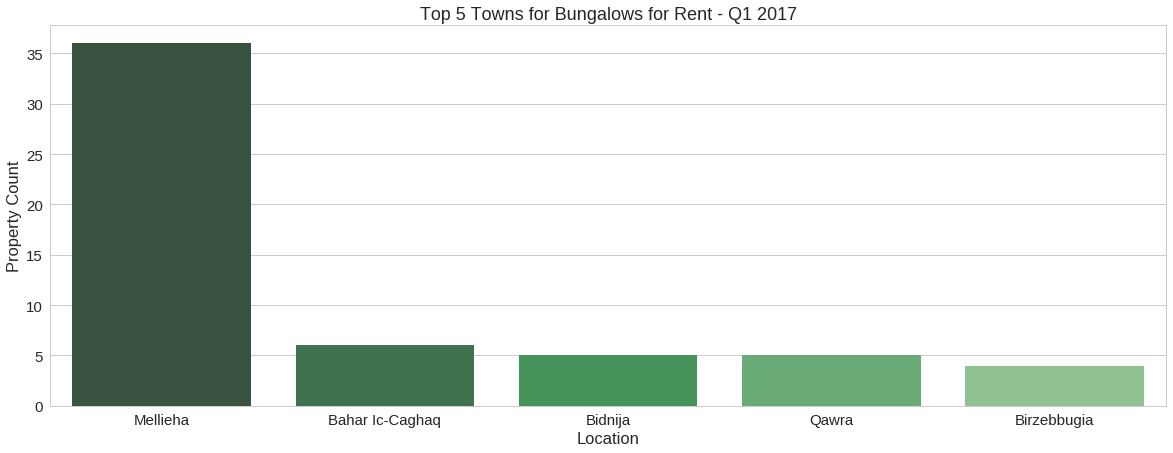
Top Towns Based on Availability of a Particular Property Type
plot_top_availability_towns('apartment')
plot_top_availability_towns('penthouse')
plot_top_availability_towns('maisonette')
plot_top_availability_towns('town house')
plot_top_availability_towns('terraced house')
plot_top_availability_towns('villa')
plot_top_availability_towns('bungalow', num_towns=5)
Country Level Analysis
Next, we take a look at the distribution of prices per property type across the whole archipelago, and compare them across datasets to gain insight into any price movements in the property market.
f, (ax1) = plt.subplots(1, 1, figsize=(14,6))
both_property_sets.sort_values(by=['dataset_id','property_type'], inplace=True)
seaborn.set_style('whitegrid');
seaborn.boxplot(x="property_type", y="price", hue="dataset_id", data=both_property_sets, palette="Greens_d", ax=ax1);
ax1.set_yscale('log');
ax1.set_xlabel('Property Type');
ax1.set_ylabel('Price in Euro (Log Scale)');
ax1.legend(title="Property in")
ax1.set_title('Malta Property Rental Price Distribution by Property Type - Q4 2016 vs Q1 2017');
wrap_labels(ax1)
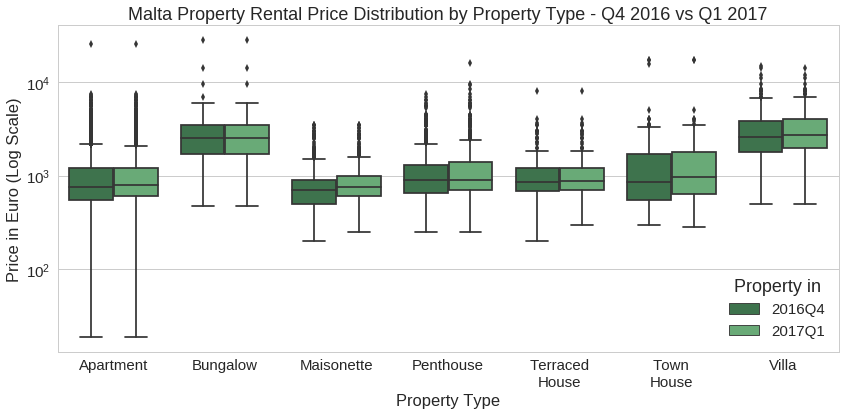
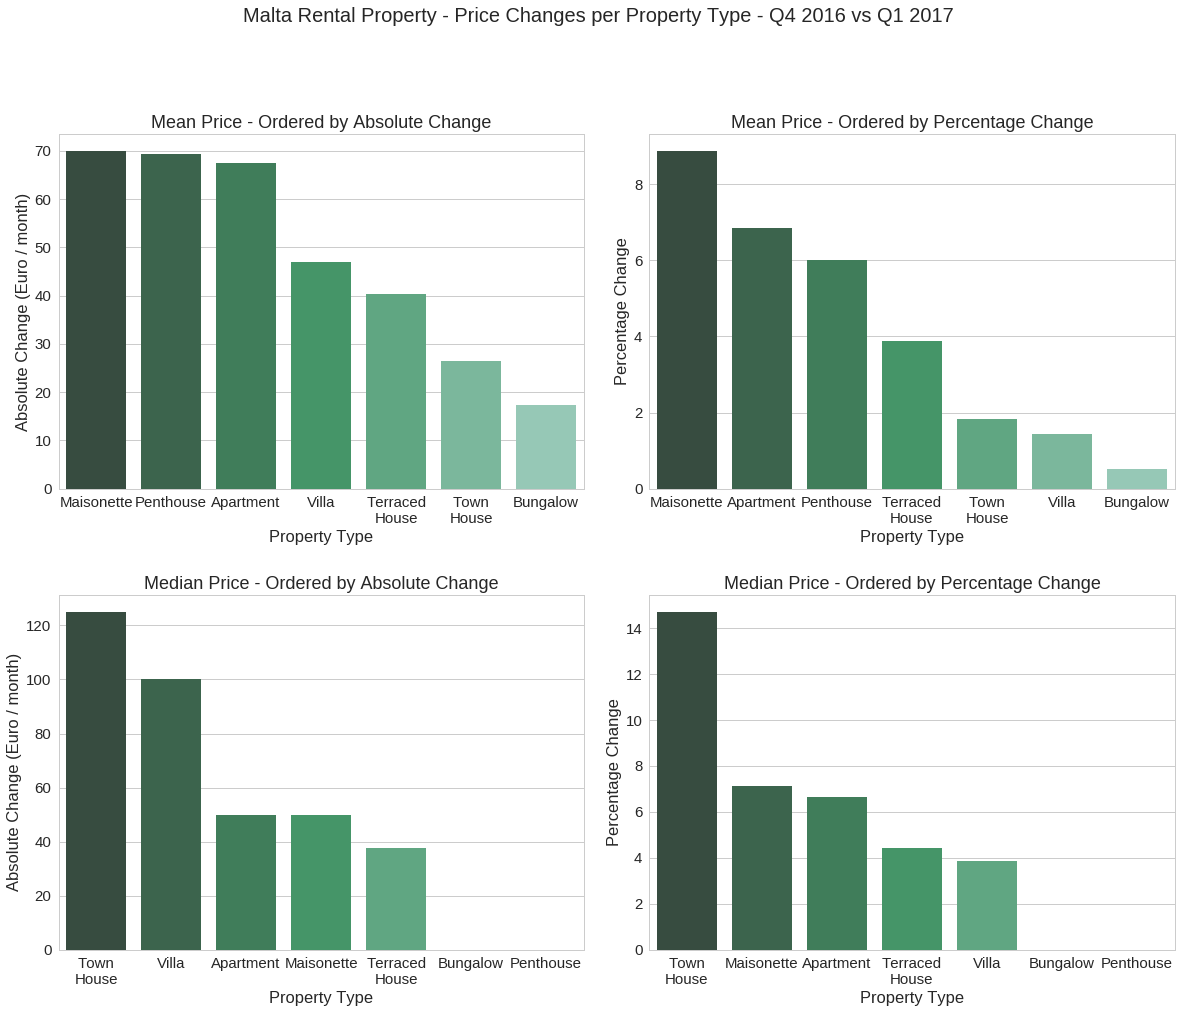
To quantify any rental price movements we will compute the mean and median price for each property type, compare them across datasets and compute the percentage difference. We will then plot bar charts to visualise this information.
set2_mean_prices_per_property_type = property_set2.groupby('property_type', as_index=False)['price'].mean()
set1_mean_prices_per_property_type = property_set1.groupby('property_type', as_index=False)['price'].mean()
property_type_mean_price_difference = pandas.DataFrame(set2_mean_prices_per_property_type['property_type'])
property_type_mean_price_difference.columns = ['Property Type']
property_type_mean_price_difference['Absolute Change (Euro / month)'] = set2_mean_prices_per_property_type['price'] - set1_mean_prices_per_property_type['price']
property_type_mean_price_difference['Percentage Change'] = numpy.round((property_type_mean_price_difference['Absolute Change (Euro / month)'] / set1_mean_prices_per_property_type['price']) * 100, 2)

set2_median_prices_per_property_type = property_set2.groupby('property_type', as_index=False)['price'].median()
set1_median_prices_per_property_type = property_set1.groupby('property_type', as_index=False)['price'].median()
property_type_median_price_difference = pandas.DataFrame(set2_median_prices_per_property_type['property_type'])
property_type_median_price_difference.columns = ['Property Type']
property_type_median_price_difference['Absolute Change (Euro / month)'] = set2_median_prices_per_property_type['price'] - set1_median_prices_per_property_type['price']
property_type_median_price_difference['Percentage Change'] = numpy.round((property_type_median_price_difference['Absolute Change (Euro / month)'] / set1_median_prices_per_property_type['price']) * 100, 2)

def plot_mmppc_by_pt(display_charts=True, display_tables=False, hspace=.3, wspace=.125):
    '''
    Plot mean and median price percentage change for each property type across the whole dataset.
    '''

    if display_charts:
        f, ((ax1, ax2), (ax3, ax4)) = plt.subplots(2, 2, figsize=(20,15))
        f.subplots_adjust(hspace=hspace, wspace=wspace);
        plt.suptitle('Malta Rental Property - Price Changes per Property Type - Q4 2016 vs Q1 2017',
                     fontsize=20, verticalalignment='bottom');

    # mean price percentage change

    if display_charts:
        property_type_mean_price_difference.sort_values(by='Absolute Change (Euro / month)', ascending=False, inplace=True)
        plot_chart_helper('Property Type', 'Absolute Change (Euro / month)', 'Mean Price - Ordered by Absolute Change',
                          property_type_mean_price_difference, ax1);
        property_type_mean_price_difference.sort_values(by='Percentage Change', ascending=False, inplace=True)
        plot_chart_helper('Property Type', 'Percentage Change', 'Mean Price - Ordered by Percentage Change',
                          property_type_mean_price_difference, ax2);

    if display_tables:
        print "Mean price percentage change per property type"
        property_type_mean_price_difference.sort_values(by='Percentage Change', ascending=False, inplace=True)
        display(HTML(property_type_mean_price_difference.to_html(formatters={'Absolute Change (Euro / month)':lambda_format_thousands}, classes='right_aligned hide_side_header')))
        print

    # median price percentage change

    if display_charts:
        property_type_median_price_difference.sort_values(by='Absolute Change (Euro / month)', ascending=False, inplace=True)
        plot_chart_helper('Property Type', 'Absolute Change (Euro / month)', 'Median Price - Ordered by Absolute Change',
                          property_type_median_price_difference, ax3);
        property_type_median_price_difference.sort_values(by='Percentage Change', ascending=False, inplace=True)
        plot_chart_helper('Property Type', 'Percentage Change', 'Median Price - Ordered by Percentage Change',
                          property_type_median_price_difference, ax4);

    if display_tables:
        print "Median price percentage change per property type"
        property_type_median_price_difference.sort_values(by='Percentage Change', ascending=False, inplace=True)
        display(HTML(property_type_median_price_difference.to_html(formatters={'Absolute Change (Euro / month)':lambda_format_thousands}, classes='right_aligned hide_side_header')))
Rental Price Changes per Property Type - Q4 2016 vs Q1 2017
plot_mmppc_by_pt()
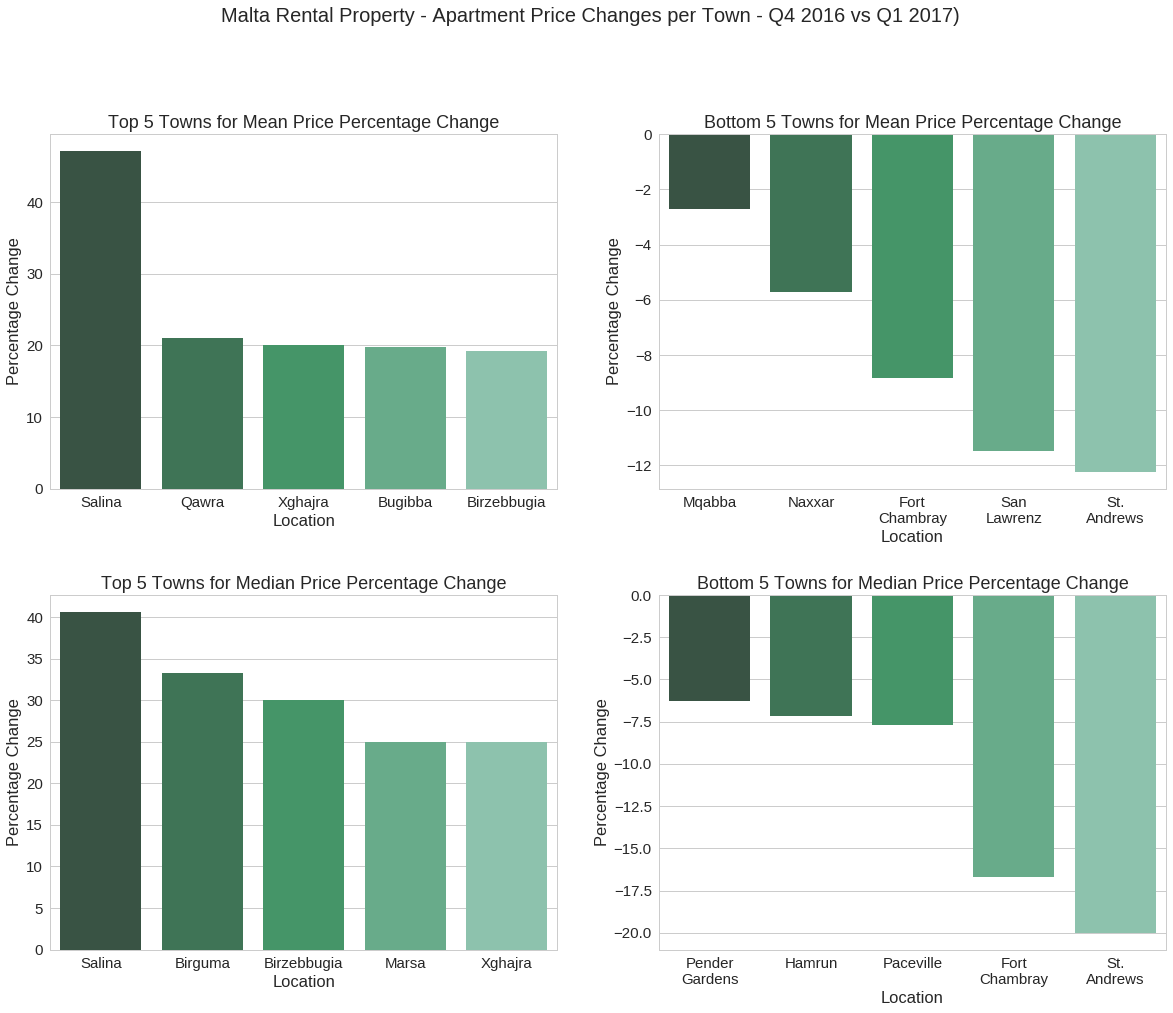
Town Level Analysis
We will now look into the data at town level, to establish whether these price trends are present across Malta and Gozo or whether they are limited to specific regions, which might shed light on the market forces at work.
set2_mean_prices_per_location_property = property_set2.groupby(['location','property_type'], as_index=False)['price'].mean()
set1_mean_prices_per_location_property = property_set1.groupby(['location','property_type'], as_index=False)['price'].mean()
mean_results = set1_mean_prices_per_location_property.merge(set2_mean_prices_per_location_property, on=['location','property_type'])
mean_results = mean_results.rename(columns = {'location':'Location', 'property_type':'Property Type', 'price_x':'Mean Q4 2016', 'price_y':'Mean Q1 2017'})
mean_results['Absolute Change (Euro / month)'] = mean_results['Mean Q1 2017'] - mean_results['Mean Q4 2016']
mean_results['Percentage Change'] = numpy.round((mean_results['Absolute Change (Euro / month)'] / mean_results['Mean Q4 2016']) * 100,2)
set2_median_prices_per_location_property = property_set2.groupby(['location','property_type'], as_index=False)['price'].median()
set1_median_prices_per_location_property = property_set1.groupby(['location','property_type'], as_index=False)['price'].median()
median_results = set1_median_prices_per_location_property.merge(set2_median_prices_per_location_property, on=['location','property_type'])
median_results = median_results.rename(columns = {'location':'Location', 'property_type':'Property Type', 'price_x':'Median Q4 2016', 'price_y':'Median Q1 2017'})
median_results['Absolute Change (Euro / month)'] = median_results['Median Q1 2017'] - median_results['Median Q4 2016']
median_results['Percentage Change'] = numpy.round((median_results['Absolute Change (Euro / month)'] / median_results['Median Q4 2016']) * 100,2)
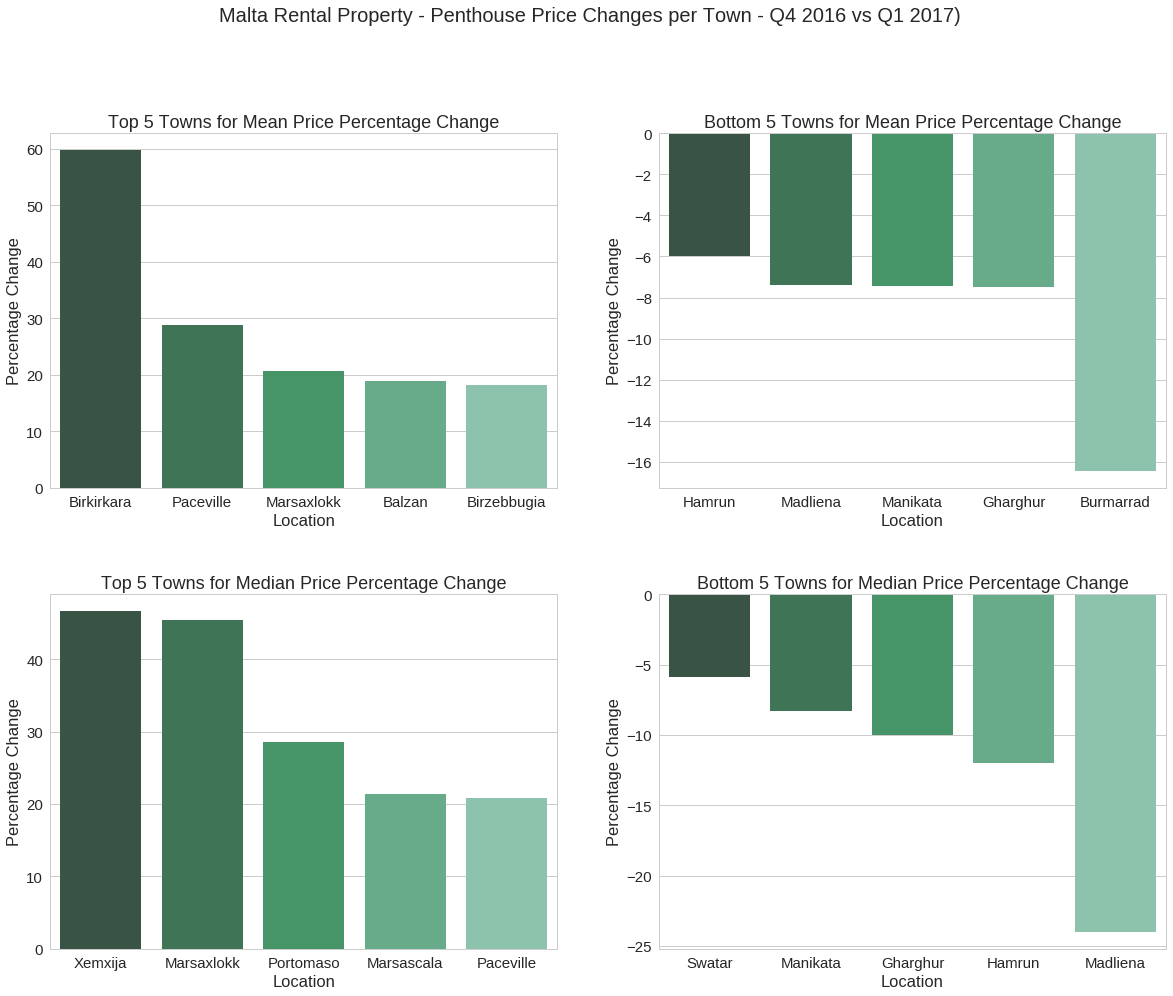
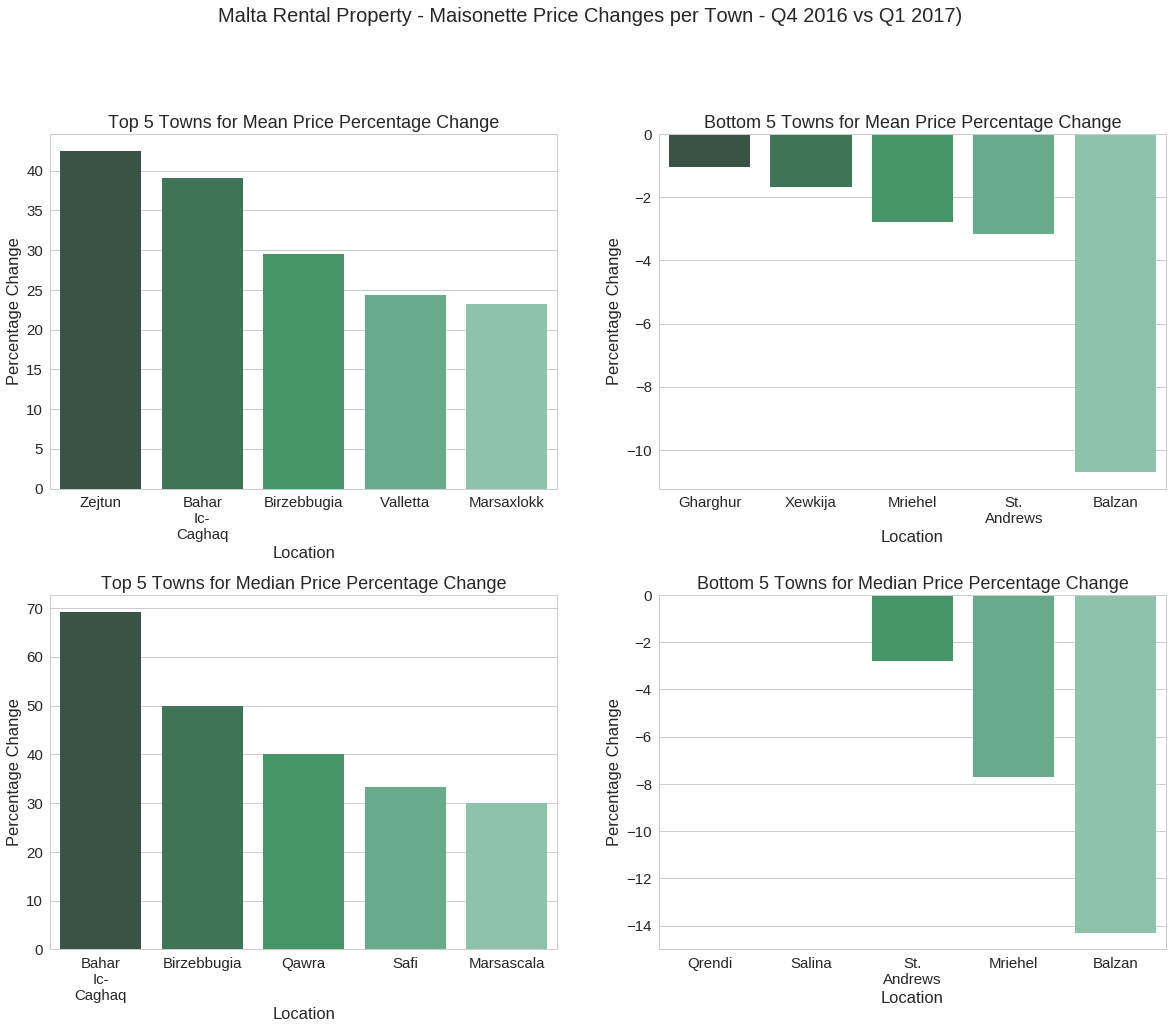
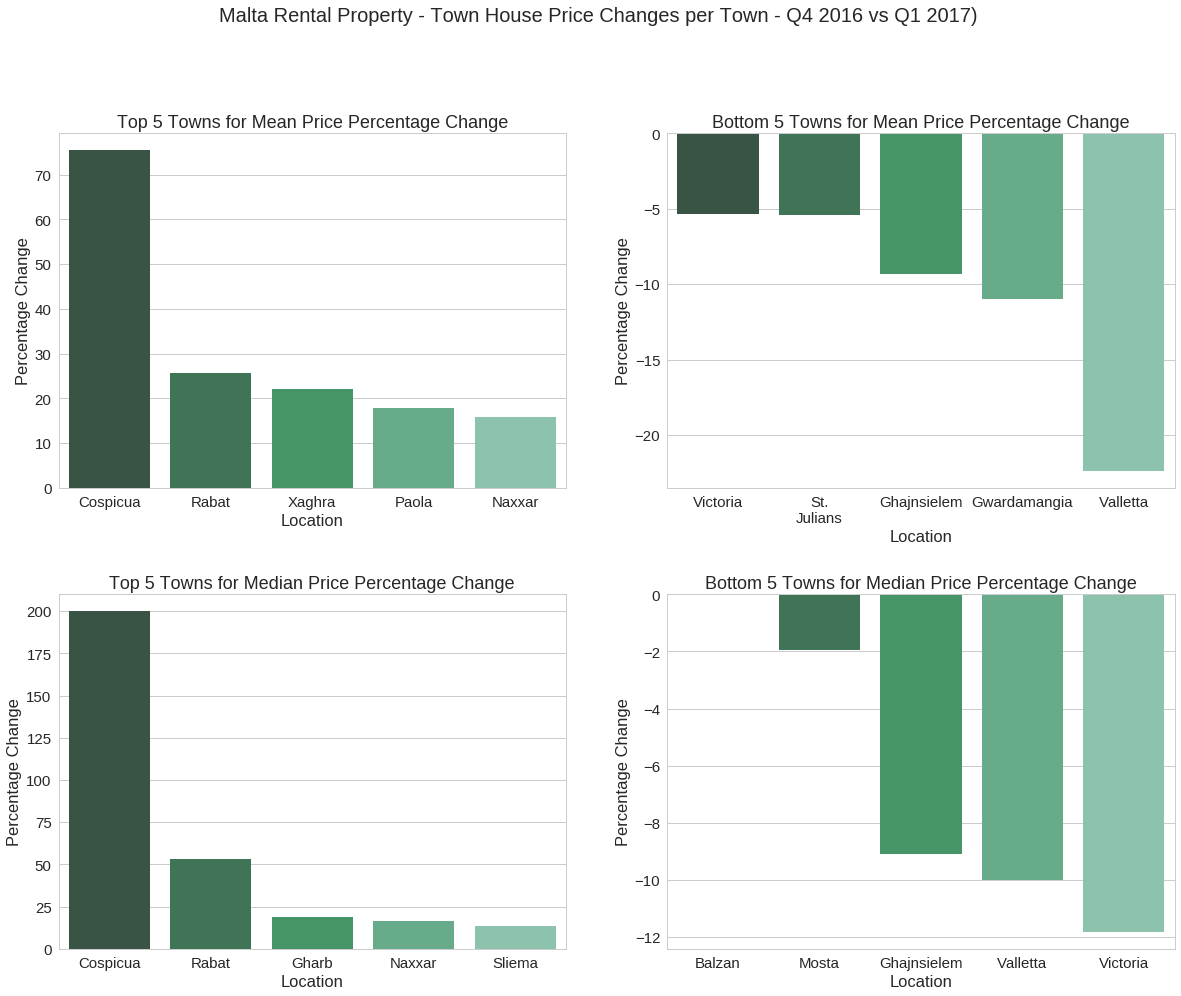
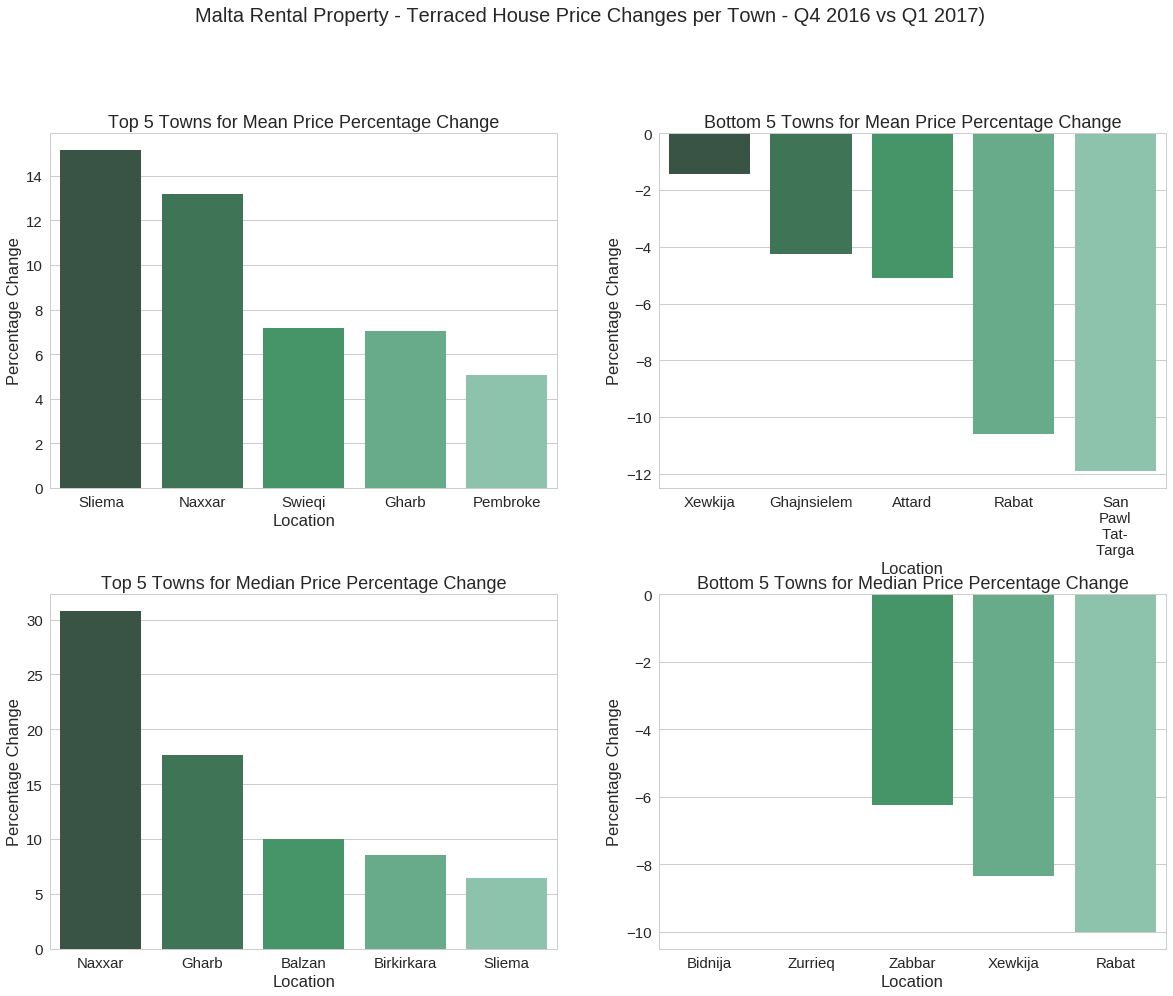
def plot_mmppc_by_ptat(property_type, display_charts=True, display_tables=False, num_towns=5, hspace=.3, wspace=.2):
'''
Plot mean and median price percentage change for the property type specified, for each town in the dataset.
'''
if display_charts:
f, ((ax1, ax2), (ax3, ax4)) = plt.subplots(2, 2, figsize=(20,15))
f.subplots_adjust(hspace=hspace, wspace=wspace);
plt.suptitle('Malta Rental Property - {0} Price Changes per Town - Q4 2016 vs Q1 2017)'.format(property_type.title()), fontsize=20, verticalalignment='bottom');
# mean price percentage change
property_type_mean = mean_results[mean_results['Property Type'] == property_type].drop('Property Type', 1)
sorted_property_type_mean = property_type_mean.sort_values(by='Percentage Change', ascending=False)
if display_charts:
plot_chart_helper('Location', 'Percentage Change', 'Top {0} Towns for Mean Price Percentage Change'.format(num_towns),
sorted_property_type_mean.head(n=num_towns), ax1);
plot_chart_helper('Location', 'Percentage Change', 'Bottom {0} Towns for Mean Price Percentage Change'.format(num_towns),
sorted_property_type_mean.tail(n=num_towns), ax2);
if display_tables:
print "{0} - Top {1} locations - Largest mean price percentage change".format(property_type, num_towns)
display(HTML(sorted_property_type_mean.head(n=num_towns).to_html(formatters={'Absolute Change (Euro / month)':lambda_format_thousands,
'Mean Q4 2016':lambda_format_thousands,
'Mean Q1 2017':lambda_format_thousands},
classes='right_aligned hide_side_header')))
print
print "{0} - Bottom {1} locations - Smallest mean price percentage change".format(property_type, num_towns)
display(HTML(sorted_property_type_mean.tail(n=num_towns).to_html(formatters={'Absolute Change (Euro / month)':lambda_format_thousands,
'Mean Q4 2016':lambda_format_thousands,
'Mean Q1 2017':lambda_format_thousands},
classes='right_aligned hide_side_header')))
print
# median price percentage change
property_type_median = median_results[median_results['Property Type'] == property_type].drop('Property Type', 1)
sorted_property_type_median = property_type_median.sort_values(by='Percentage Change', ascending=False)
if display_charts:
plot_chart_helper('Location', 'Percentage Change', 'Top {0} Towns for Median Price Percentage Change'.format(num_towns),
sorted_property_type_median.head(n=num_towns), ax3);
plot_chart_helper('Location', 'Percentage Change', 'Bottom {0} Towns for Median Price Percentage Change'.format(num_towns),
sorted_property_type_median.tail(n=num_towns), ax4);
if display_tables:
print "{0} - Top {1} locations - Largest median price percentage change".format(property_type, num_towns)
display(HTML(sorted_property_type_median.head(n=num_towns).to_html(formatters={'Absolute Change (Euro / month)':lambda_format_thousands,
'Median Q4 2016':lambda_format_thousands,
'Median Q1 2017':lambda_format_thousands},
classes='right_aligned hide_side_header')))
print
print "{0} - Bottom {1} locations - Smallest median price percentage change".format(property_type, num_towns)
display(HTML(sorted_property_type_median.tail(n=num_towns).to_html(formatters={'Absolute Change (Euro / month)':lambda_format_thousands,
'Median Q4 2016':lambda_format_thousands,
'Median Q1 2017':lambda_format_thousands},
classes='right_aligned hide_side_header')))
Apartment Price Changes per Town - Q4 2016 vs Q1 2017
plot_mmppc_by_ptat('apartment')
Penthouse Price Changes per Town - Q4 2016 vs Q1 2017
plot_mmppc_by_ptat('penthouse')
Maisonette Price Changes per Town - Q4 2016 vs Q1 2017
plot_mmppc_by_ptat('maisonette')
Town House Price Changes per Town - Q4 2016 vs Q1 2017
plot_mmppc_by_ptat('town house')
Terraced House Price Changes per Town - Q4 2016 vs Q1 2017
plot_mmppc_by_ptat('terraced house')
Villa Price Changes per Town - Q4 2016 vs Q1 2017
plot_mmppc_by_ptat('villa')
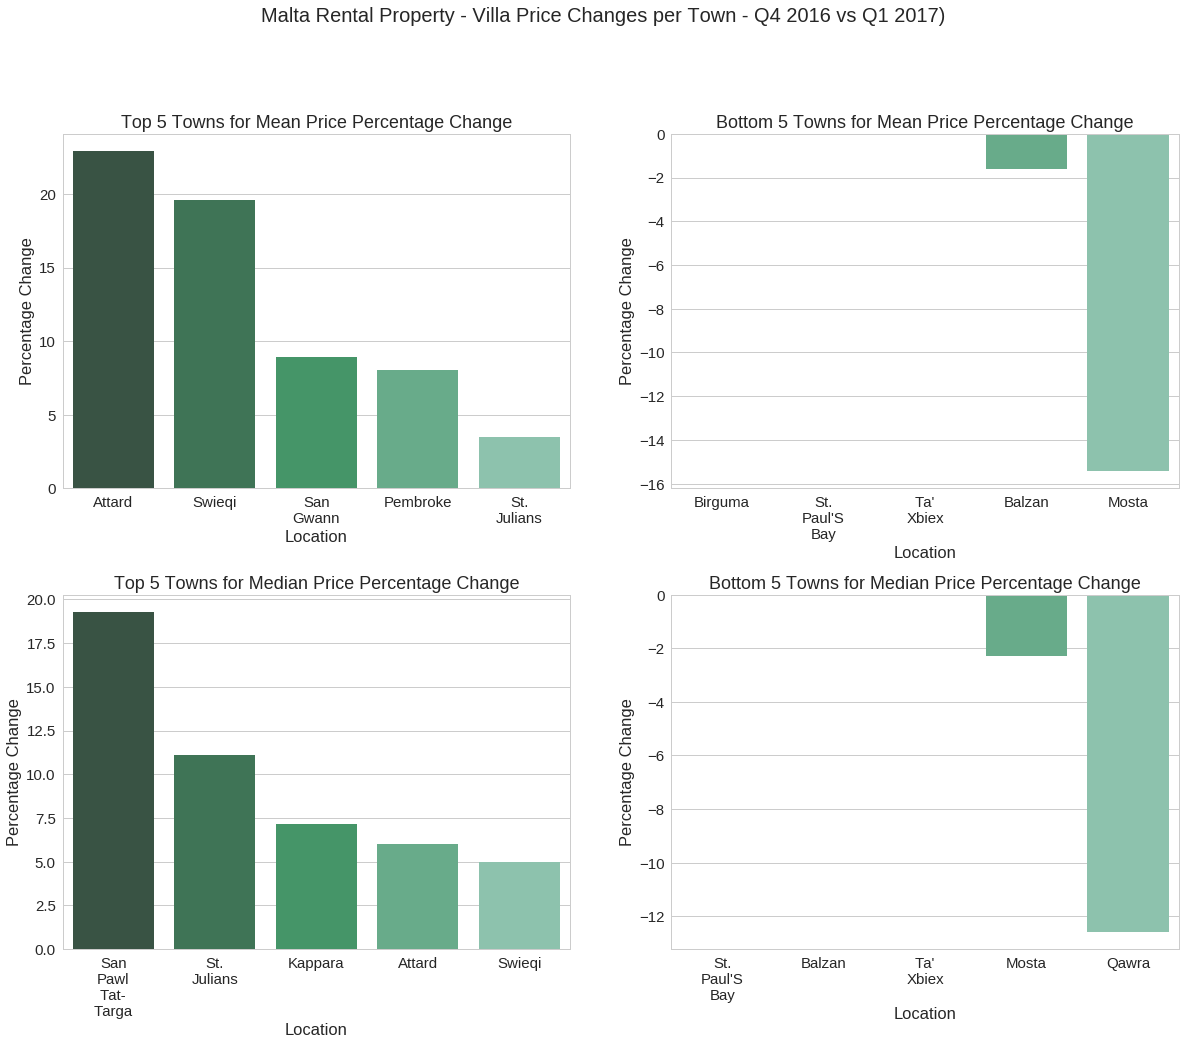
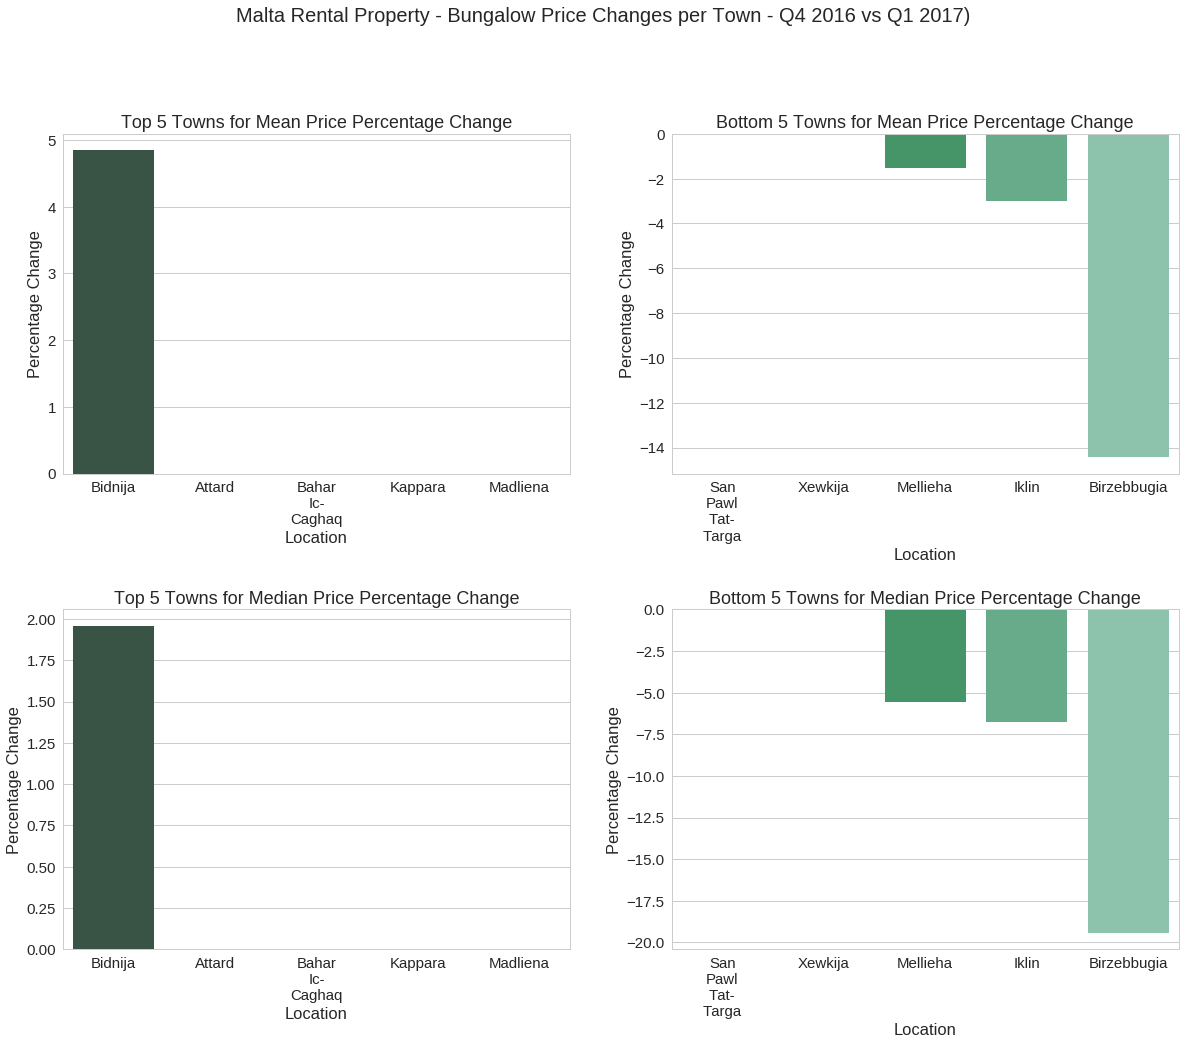
Bungalow Price Changes per Town - Q4 2016 vs Q1 2017
plot_mmppc_by_ptat('bungalow', hspace=.4)
def boxplot_chart_helper(x_field_label, y_field_label, chart_title, chart_data, chart_order, plot_swarm=True, y_max_lim=0, top=True, num_towns=5):
    '''
    Small helper to plot seaborn.boxplot, with an optional overlayed swarm plot.
    '''

    if top:
        boxplot_colour = '#FF3333'
        swarmplot_colour = '#333333'
    else:
        boxplot_colour = '#80CCFF'
        swarmplot_colour = '#333333'

    f, (ax1) = plt.subplots(1, 1, figsize=(20,7))
    seaborn.set_style('whitegrid');
    seaborn.boxplot(x=x_field_label, y=y_field_label,
                    data=chart_data, order=chart_order,
                    color=boxplot_colour, ax=ax1, showfliers=False);

    if plot_swarm:
        seaborn.swarmplot(x=x_field_label, y=y_field_label,
                          data=chart_data, order=chart_order,
                          color=swarmplot_colour, size=7, ax=ax1);

    #plt.setp(ax1.get_xticklabels(), rotation=90);
    if y_max_lim > 0:
        plt.ylim(0, y_max_lim)
    else:
        plt.ylim(0);
    ax1.set_ylabel(y_field_label);
    ax1.set_xlabel(x_field_label);
    ax1.set_title(chart_title);

    wrap_labels(ax1)

def plot_n_towns(top=True, property_type=None, num_towns=10, plot_swarm=True, y_max_lim=0):
    '''
    Plots a boxplot, with optional swarm plots, for the top or bottom num_towns based on
    mean and median price for either all properties or a specific property.

    top: True (default) | False - If set to false plot bottom towns.

    property_type: By default set to None, which means compute mean and median for all
                   properties within each town. A specific property type can be any one
                   of:- apartment, penthouse, maisonette, town house, terraced house,
                        villa, bungalow.

    num_towns: Number of towns to include, by default set to 10.
    '''

    if property_type is None:
        filtered_property = property_set2
    else:
        property_type_list = ['apartment','penthouse','maisonette','town house',
                              'terraced house','villa','bungalow']
        if property_type not in property_type_list:
            print "property_type must be one of {0}.".format(property_type_list)
            return
        filtered_property = property_set2[property_set2['property_type'] == property_type]
    filtered_grouped_property = filtered_property.groupby(['location'], as_index=False)

    location_mean = filtered_grouped_property['price'].mean().sort_values(by='price', ascending=False)
    location_mean = location_mean.head(n=num_towns) if top else location_mean.tail(n=num_towns)
    location_mean = list(location_mean['location'])
    location_mean_filtered_data = filtered_property[filtered_property['location'].isin(location_mean)]
    location_mean_filtered_data = location_mean_filtered_data.rename(columns = {'location':'Location', 'price':'Price (Euro / month)'})

    location_median = filtered_grouped_property['price'].median().sort_values(by='price', ascending=False)
    location_median = location_median.head(n=num_towns) if top else location_median.tail(n=num_towns)
    location_median = list(location_median['location'])
    location_median_filtered_data = filtered_property[filtered_property['location'].isin(location_median)]
    location_median_filtered_data = location_median_filtered_data.rename(columns = {'location':'Location', 'price':'Price (Euro / month)'})

    if property_type is None:
        chart_title_mean = '{0} {1} {2} Localities by Mean Rental Price Q1 2017'.format('Top' if top else 'Bottom', num_towns, 'Most Expensive' if top else 'Least Expensive')
    else:
        chart_title_mean = '{0} {1} {2} Localities for {3}s by Mean Rental Price Q1 2017'.format('Top' if top else 'Bottom', num_towns, 'Most Expensive' if top else 'Least Expensive', property_type.title())

    boxplot_chart_helper('Location', 'Price (Euro / month)', chart_title_mean, location_mean_filtered_data,
                         location_mean, plot_swarm, y_max_lim, top, num_towns);

    if property_type is None:
        chart_title_median = '{0} {1} {2} Localities by Median Rental Price Q1 2017'.format('Top' if top else 'Bottom', num_towns, 'Most Expensive' if top else 'Least Expensive')
    else:
        chart_title_median = '{0} {1} {2} Localities for {3}s by Median Rental Price Q1 2017'.format('Top' if top else 'Bottom', num_towns, 'Most Expensive' if top else 'Least Expensive', property_type.title())

    boxplot_chart_helper('Location', 'Price (Euro / month)', chart_title_median, location_median_filtered_data,
                         location_median, plot_swarm, y_max_lim, top, num_towns);
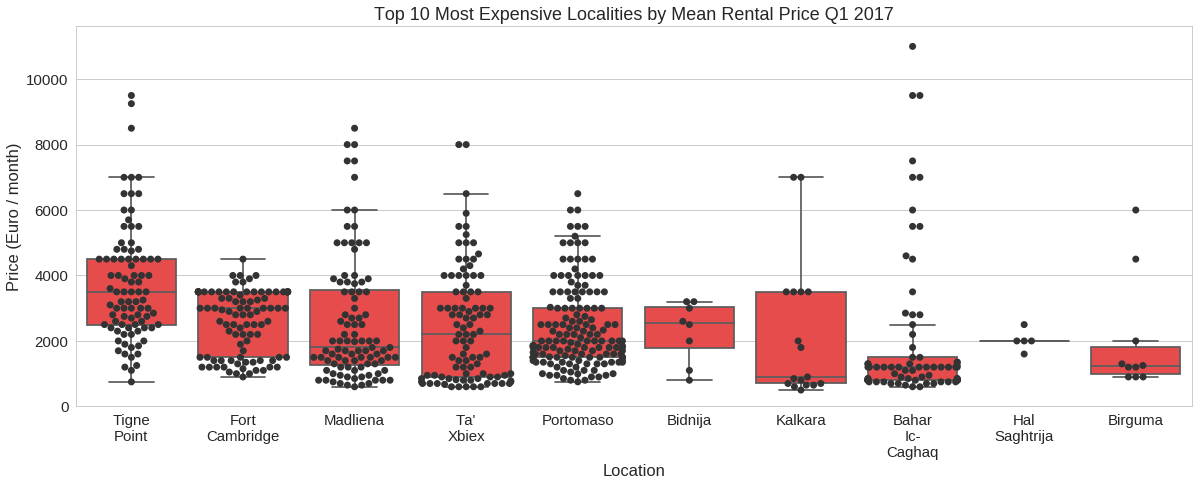
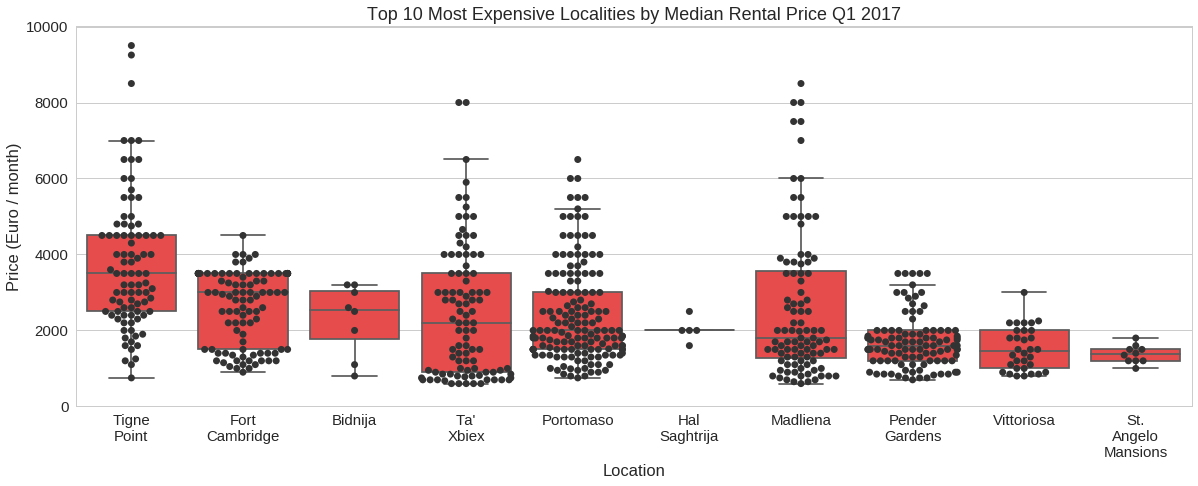
Most Expensive Localities as of Q1 2017
In this section we list the overall most expensive localities using the mean and median prices, and then provide a breakdown by property type.
Most Expensive Localities Overall as of Q1 2017
plot_n_towns()
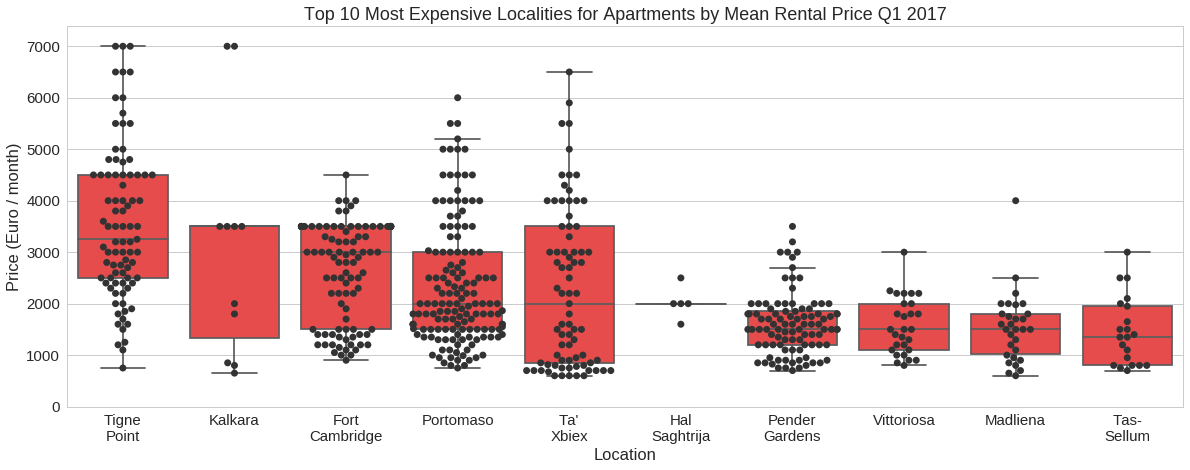
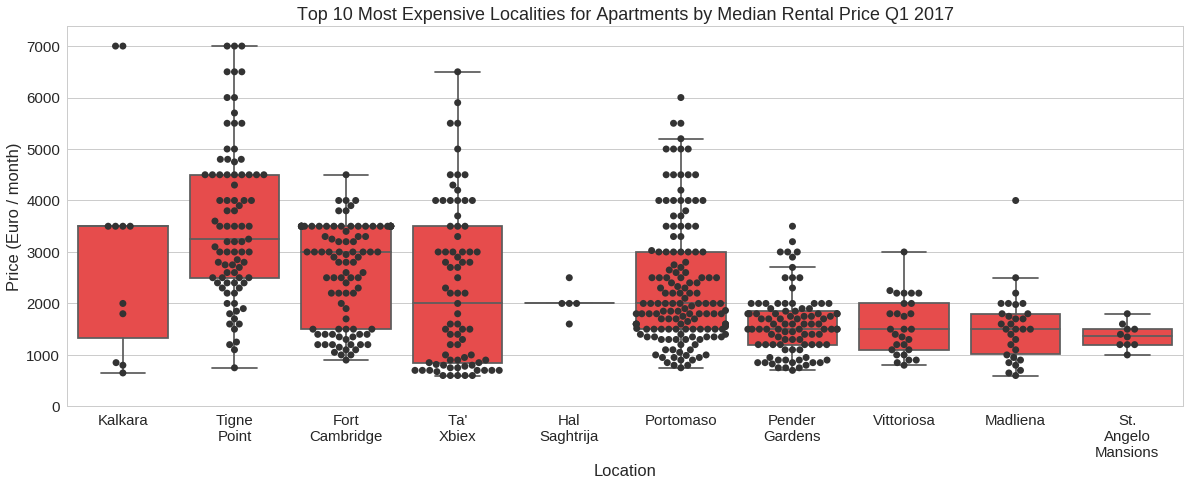
Most Expensive Localities for Apartments as of Q1 2017
plot_n_towns(property_type='apartment')
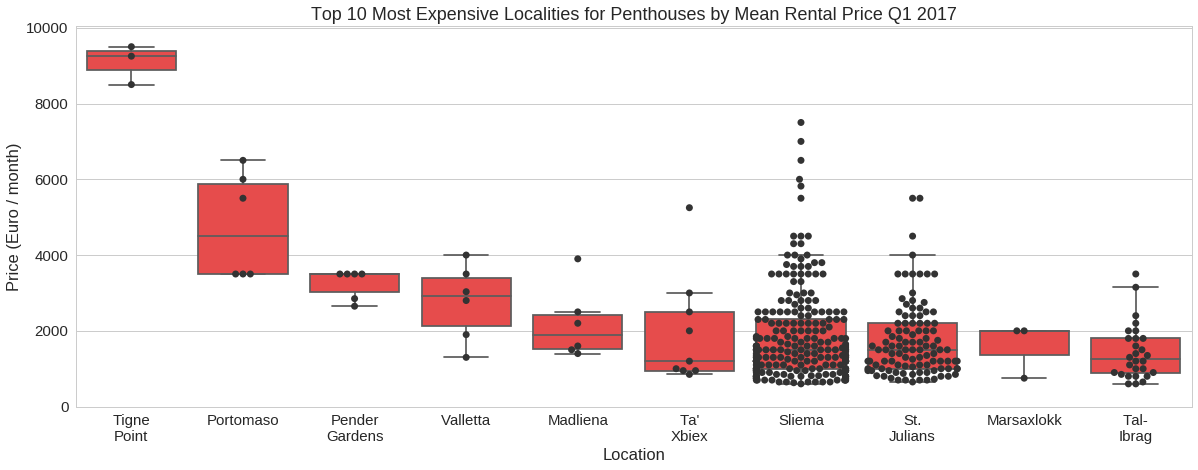
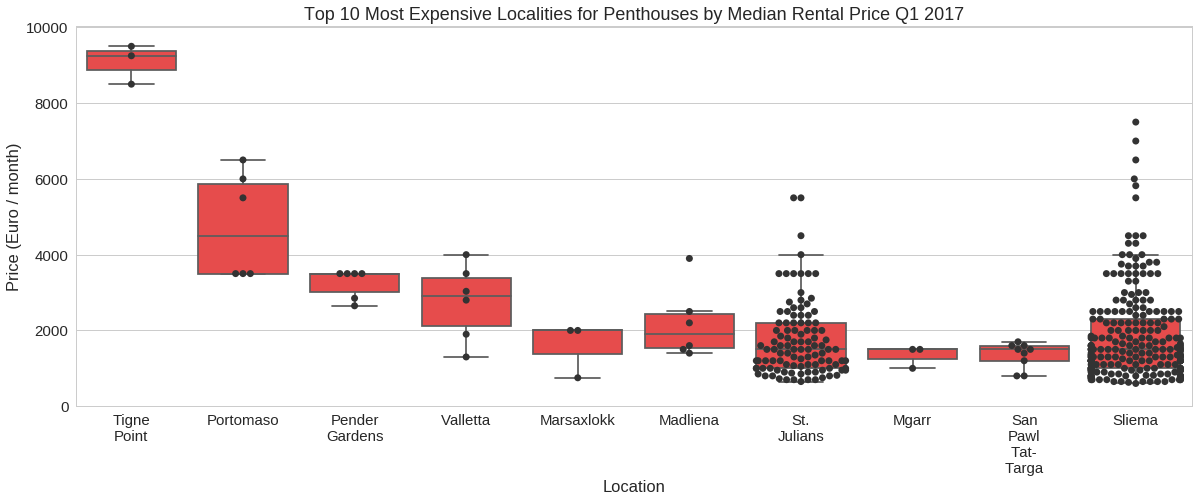
Most Expensive Localities for Penthouses as of Q1 2017
plot_n_towns(property_type='penthouse')
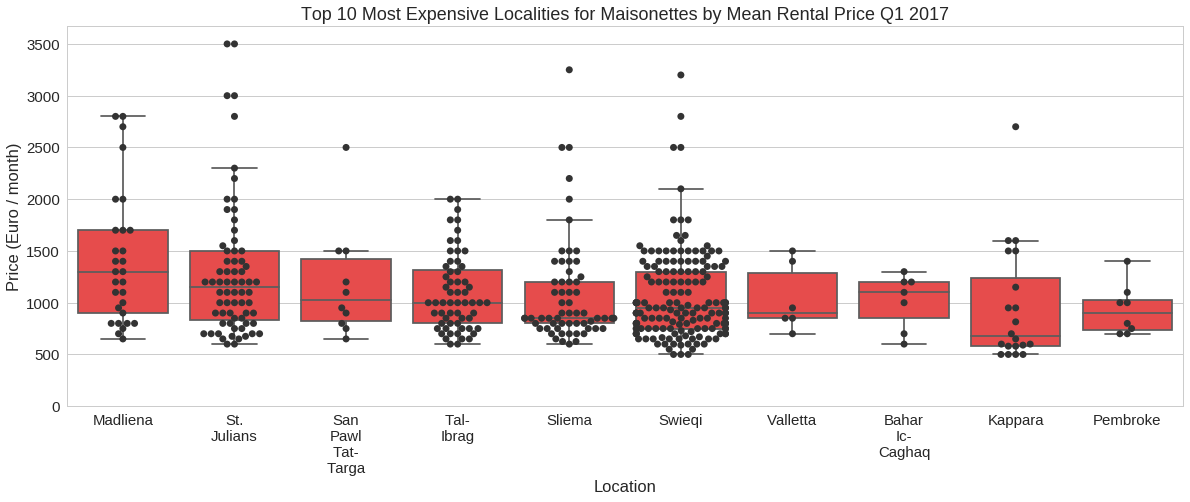
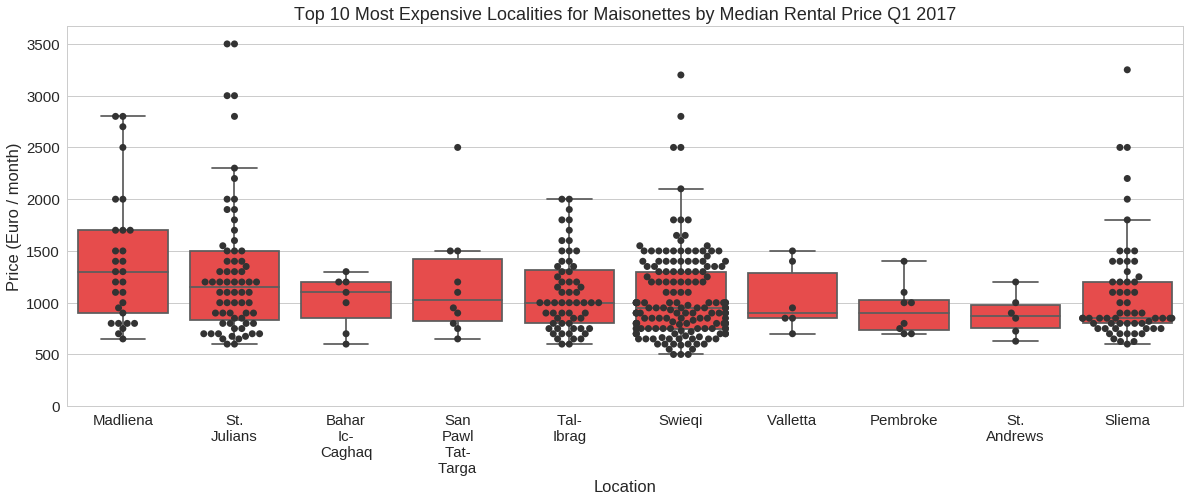
Most Expensive Localities for Maisonettes as of Q1 2017
plot_n_towns(property_type='maisonette')
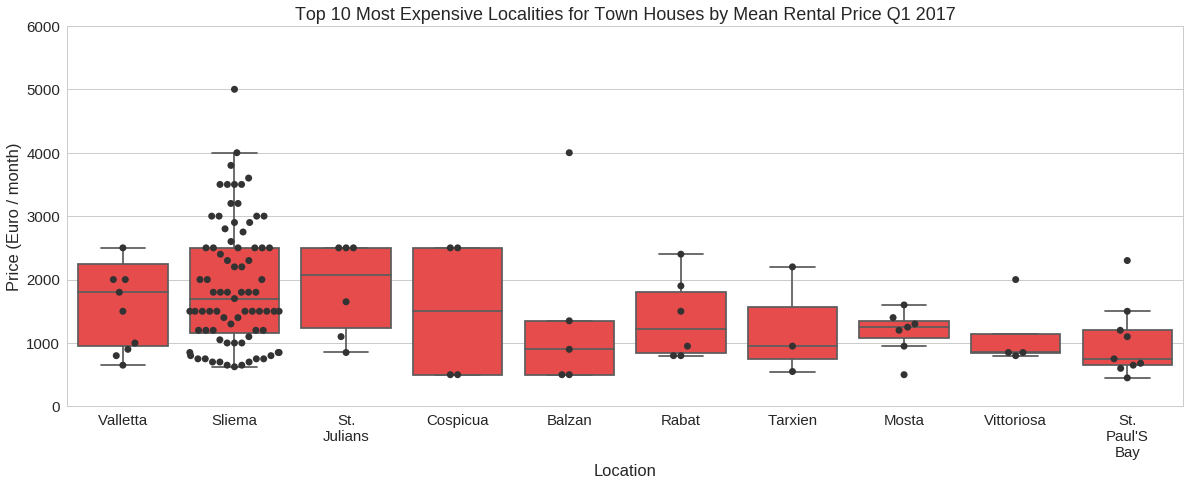
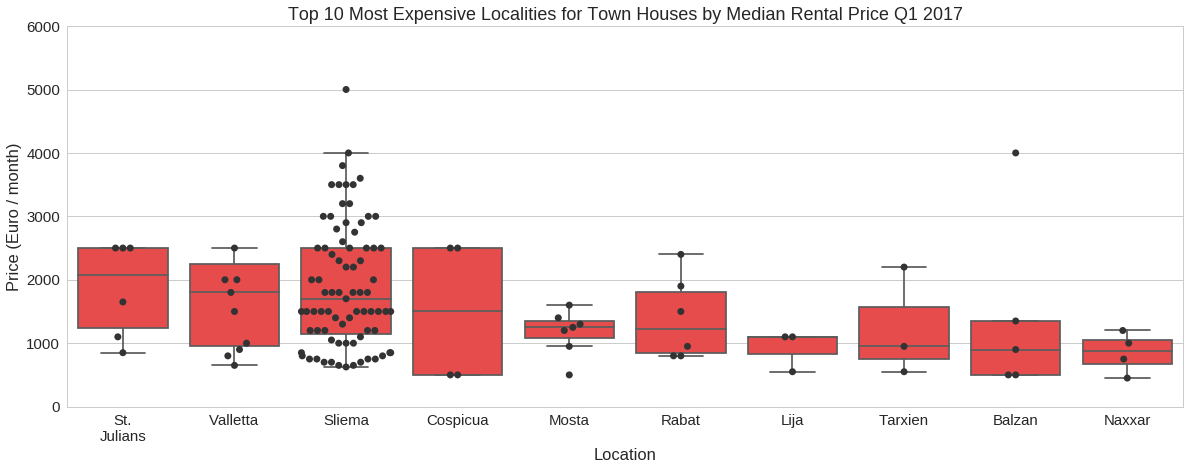
Most Expensive Localities for Town Houses as of Q1 2017
plot_n_towns(property_type='town house', y_max_lim=6000)
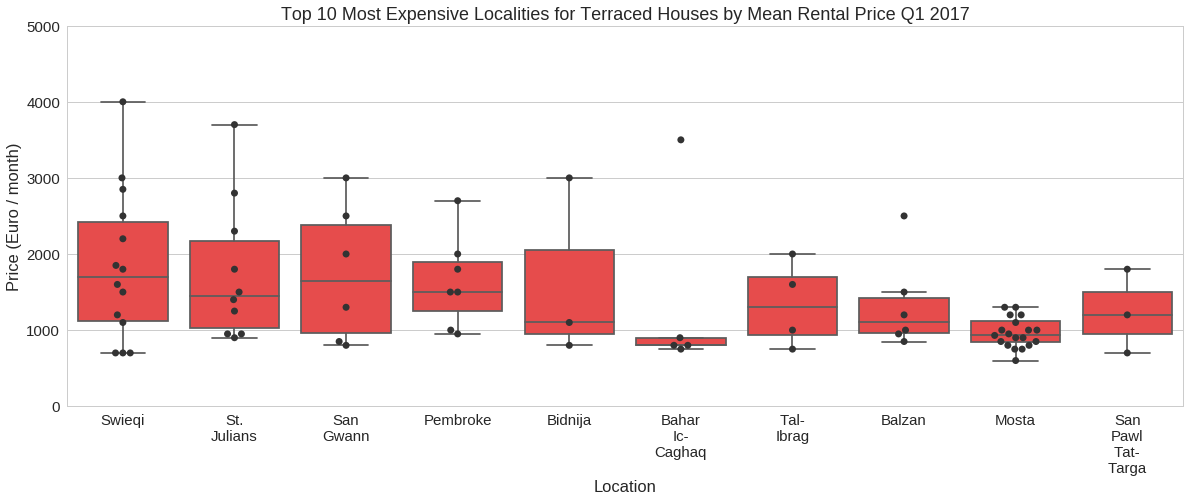
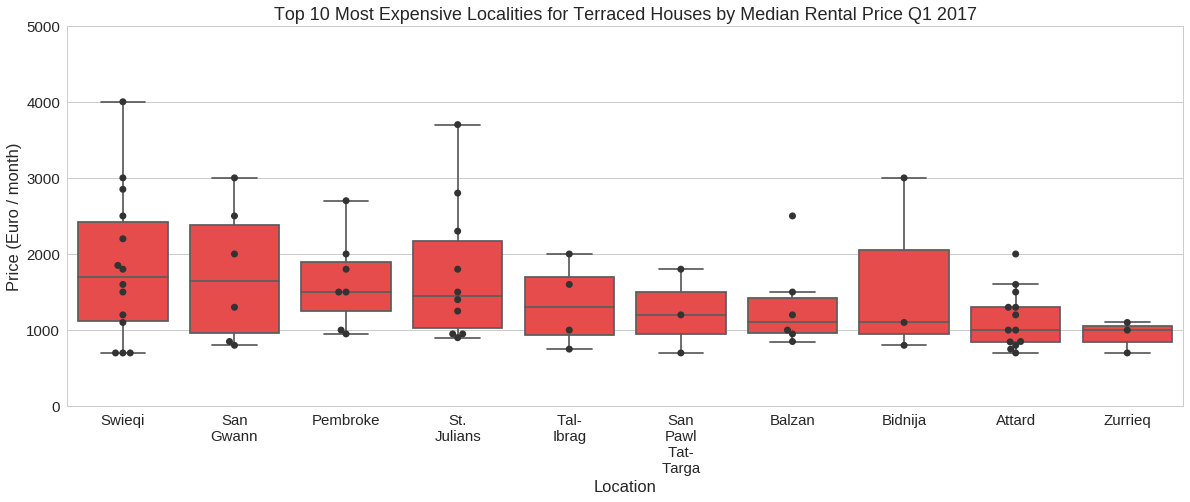
Most Expensive Localities for Terraced Houses as of Q1 2017
plot_n_towns(property_type='terraced house', y_max_lim=5000)
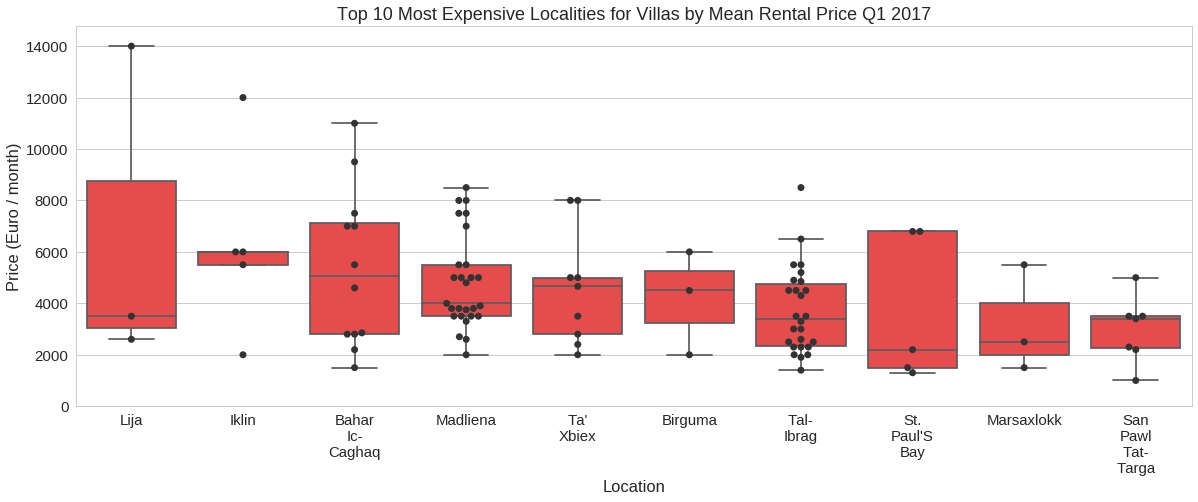
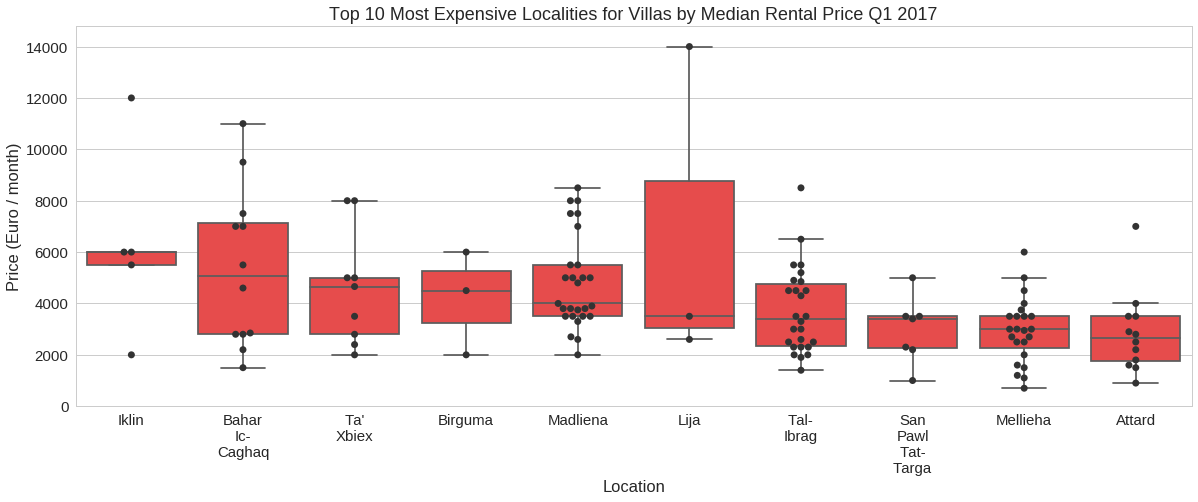
Most Expensive Localities for Villas as of Q1 2017
plot_n_towns(property_type='villa')
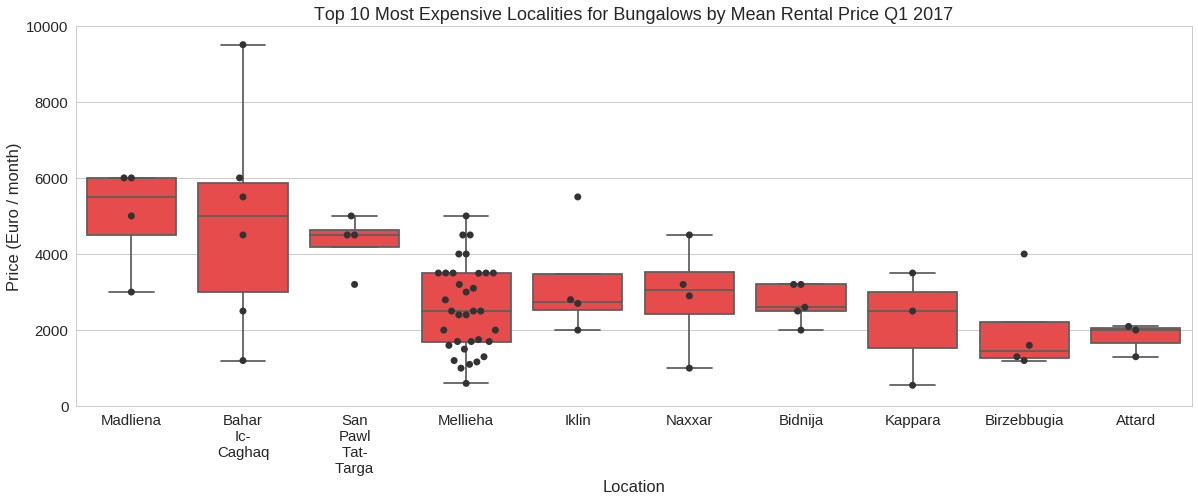
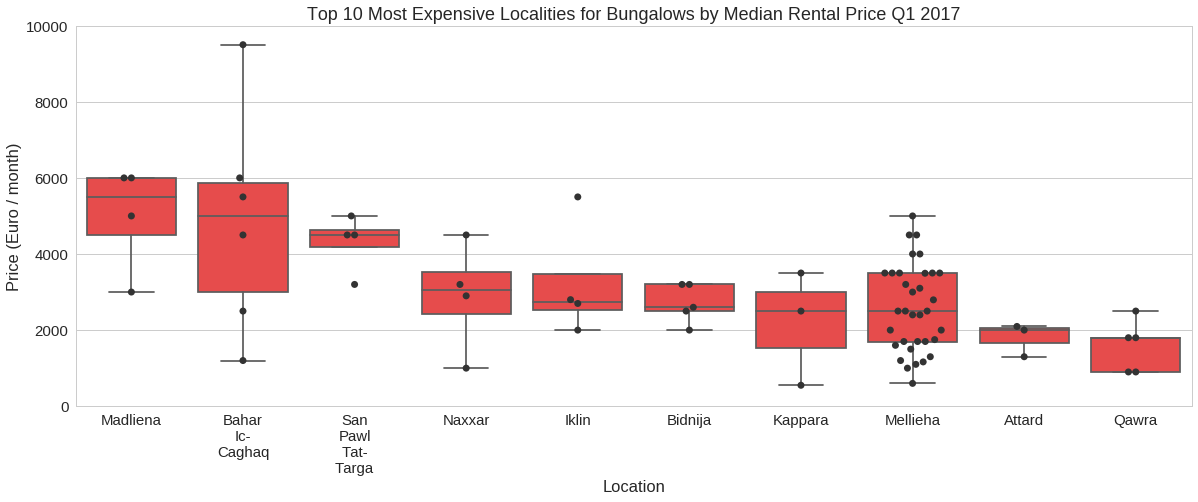
Most Expensive Localities for Bungalows as of Q1 2017
plot_n_towns(property_type='bungalow', y_max_lim=10000)
Least Expensive Localities as of Q1 2017
In this section we list the overall least expensive localities using the mean and median prices, and then provide a breakdown by property type.
Least Expensive Localities Overall as of Q1 2017
plot_n_towns(top=False, y_max_lim=1500)
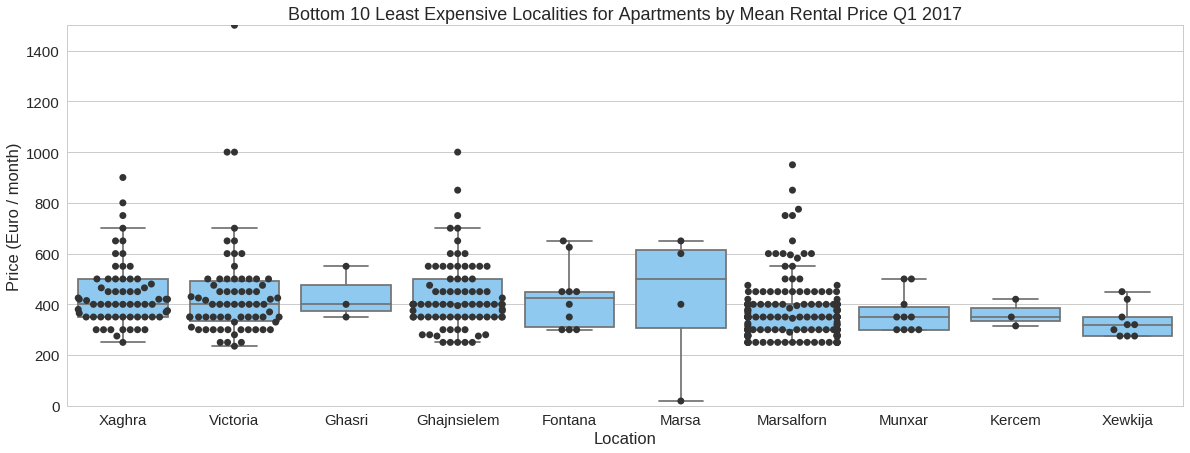
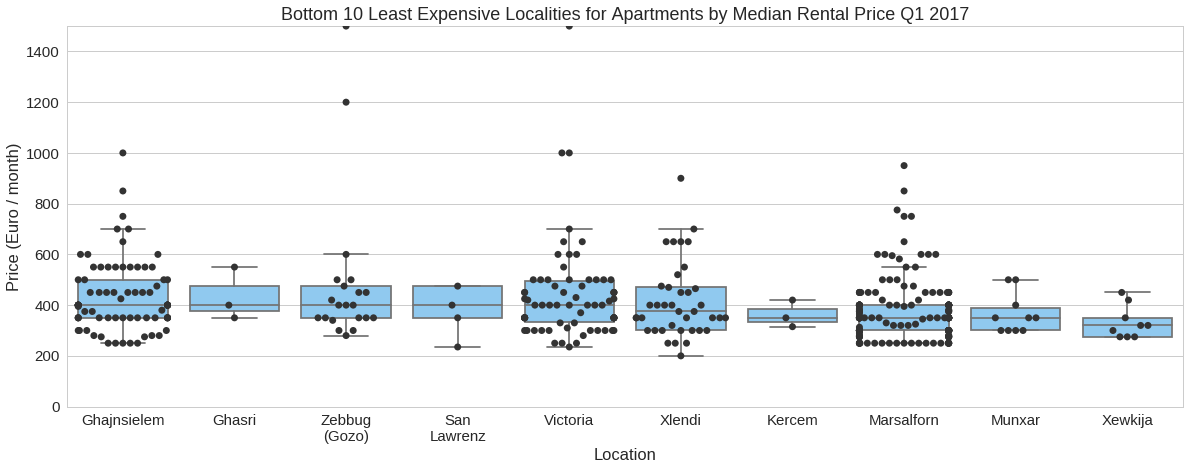
Least Expensive Localities for Apartments as of Q1 2017
plot_n_towns(top=False, property_type='apartment', y_max_lim=1500)
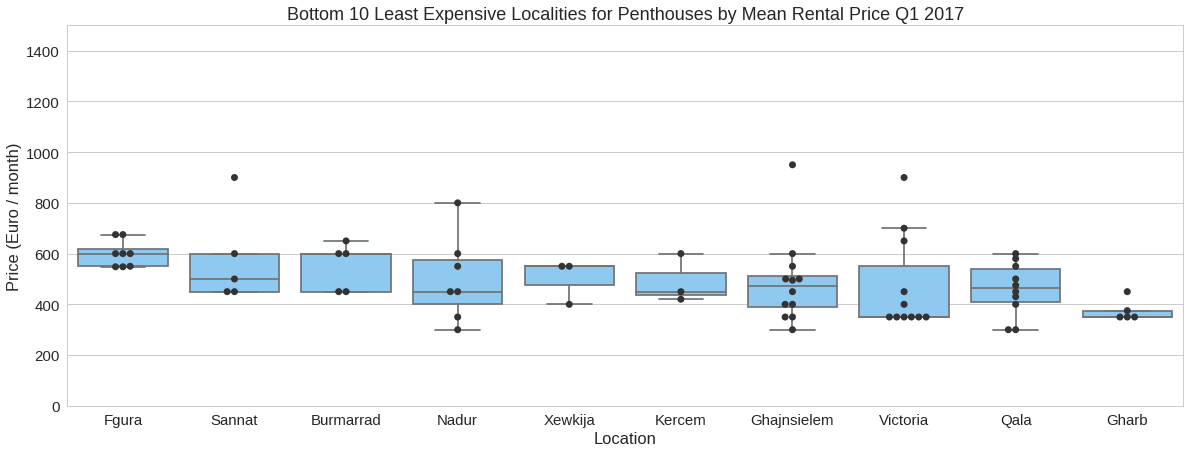
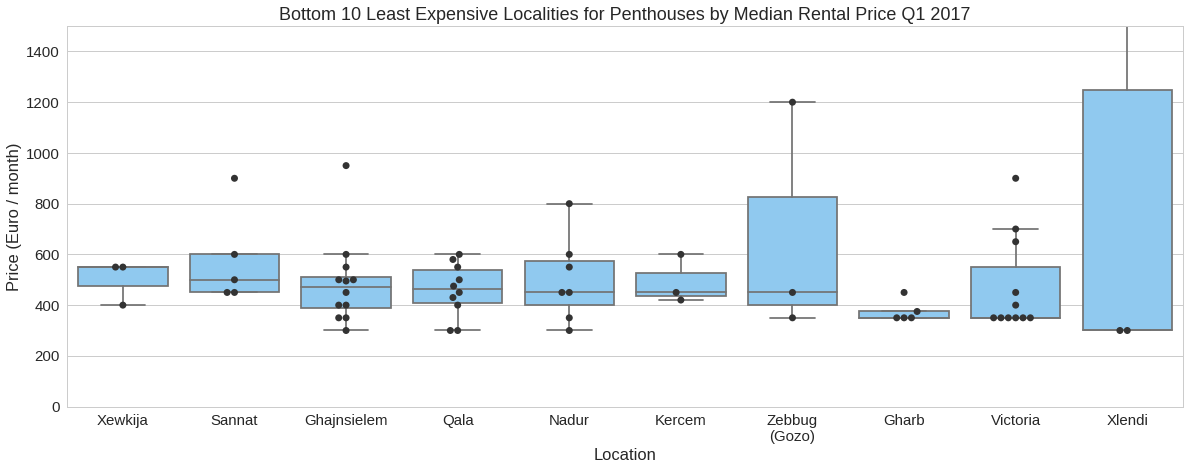
Least Expensive Localities for Penthouses as of Q1 2017
plot_n_towns(top=False, property_type='penthouse', y_max_lim=1500)
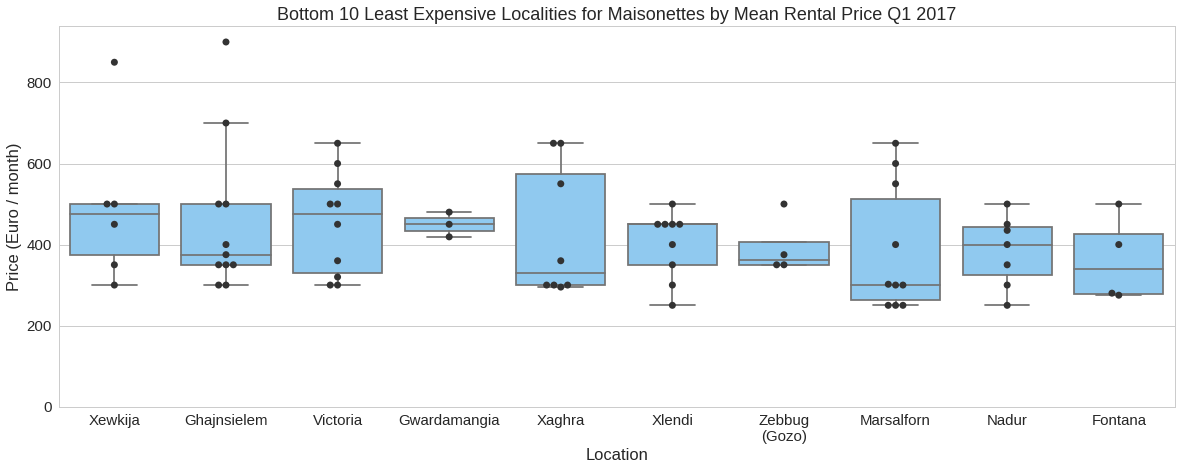
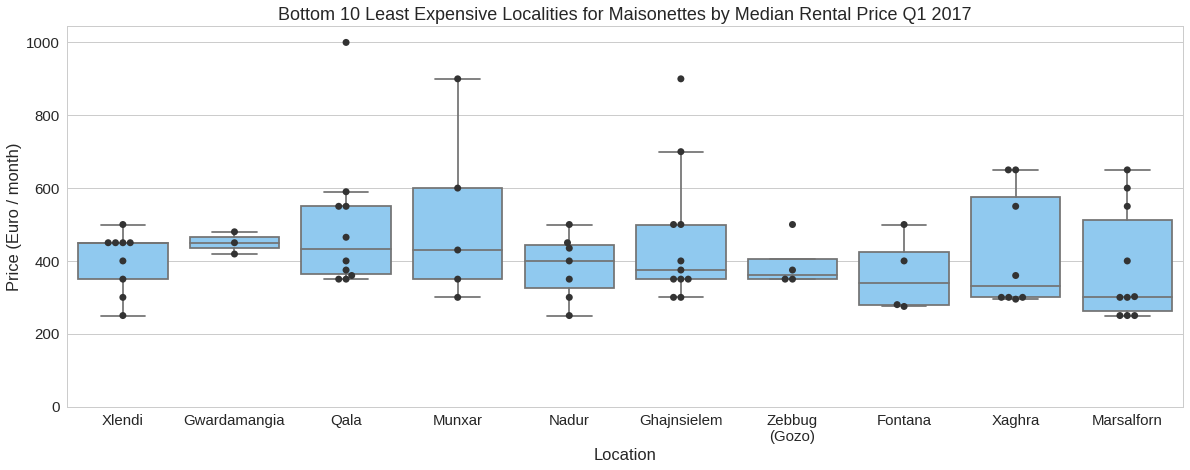
Least Expensive Localities for Maisonettes as of Q1 2017
plot_n_towns(top=False, property_type='maisonette')
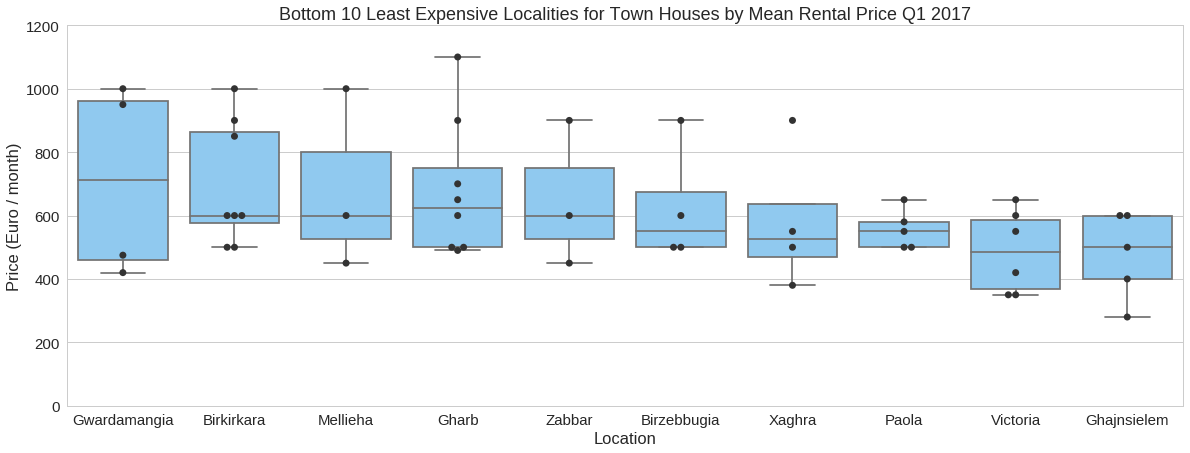
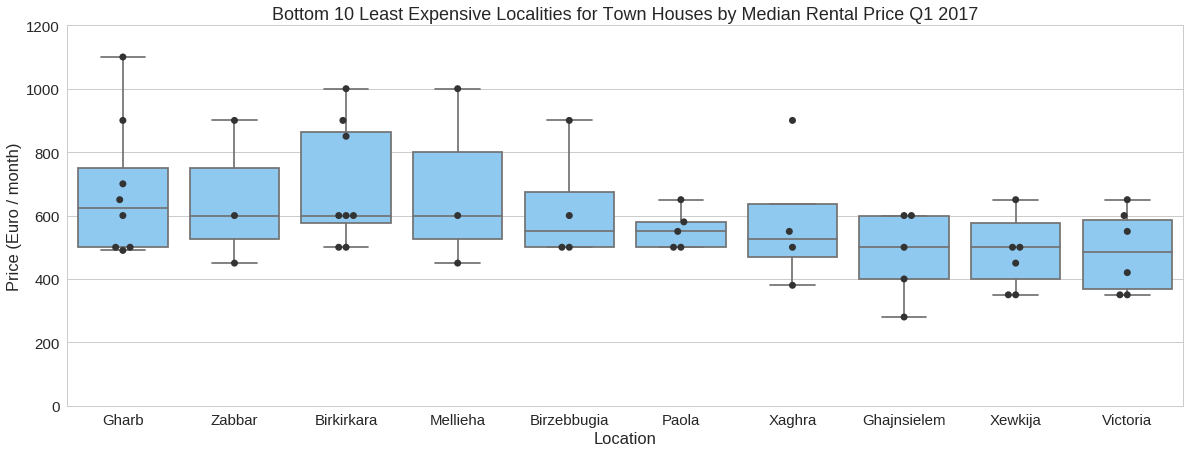
Least Expensive Localities for Town Houses as of Q1 2017
plot_n_towns(top=False, property_type='town house', y_max_lim=1200)
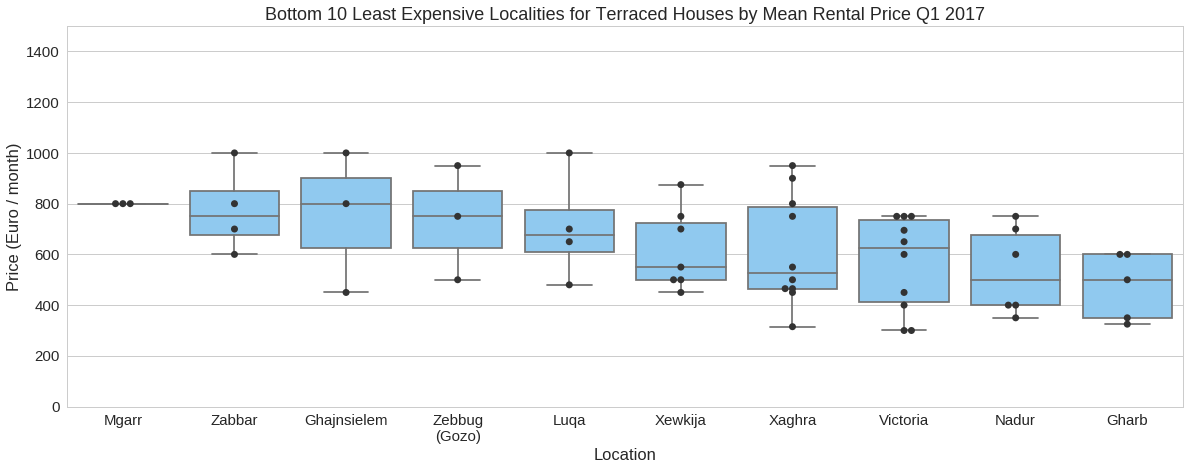
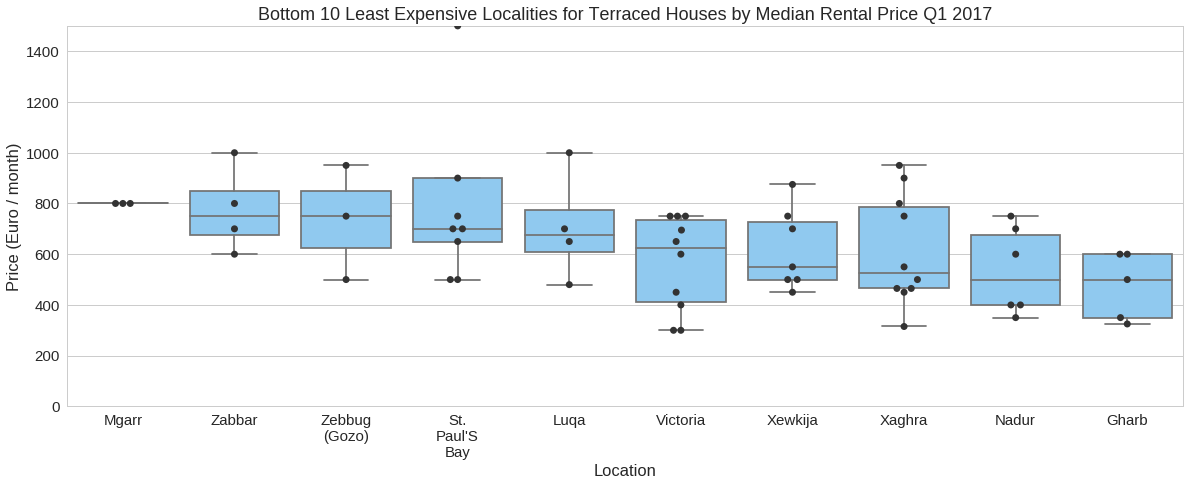
Least Expensive Localities for Terraced Houses as of Q1 2017
plot_n_towns(top=False, property_type='terraced house', y_max_lim=1500)
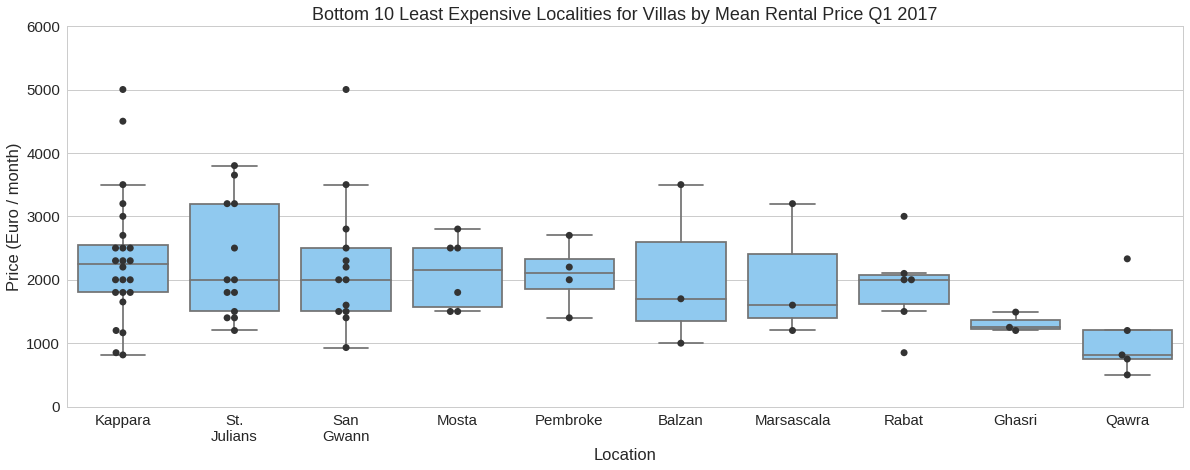
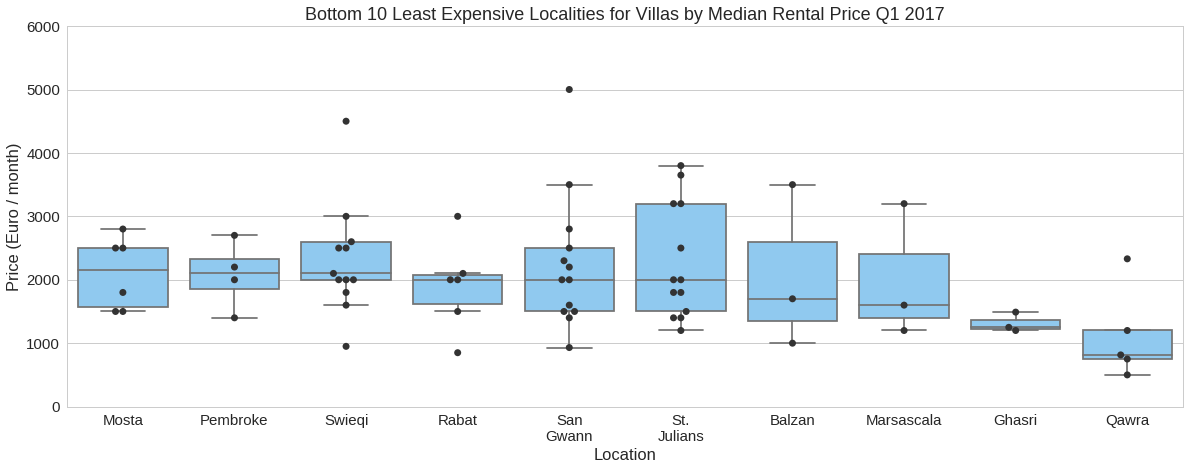
Least Expensive Localities for Villas as of Q1 2017
plot_n_towns(top=False, property_type='villa', y_max_lim=6000)
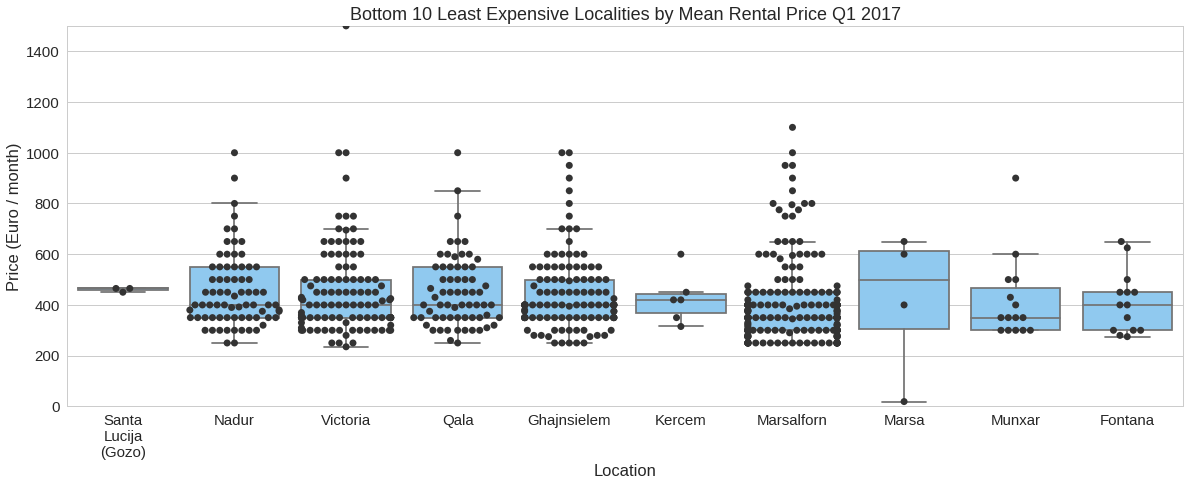
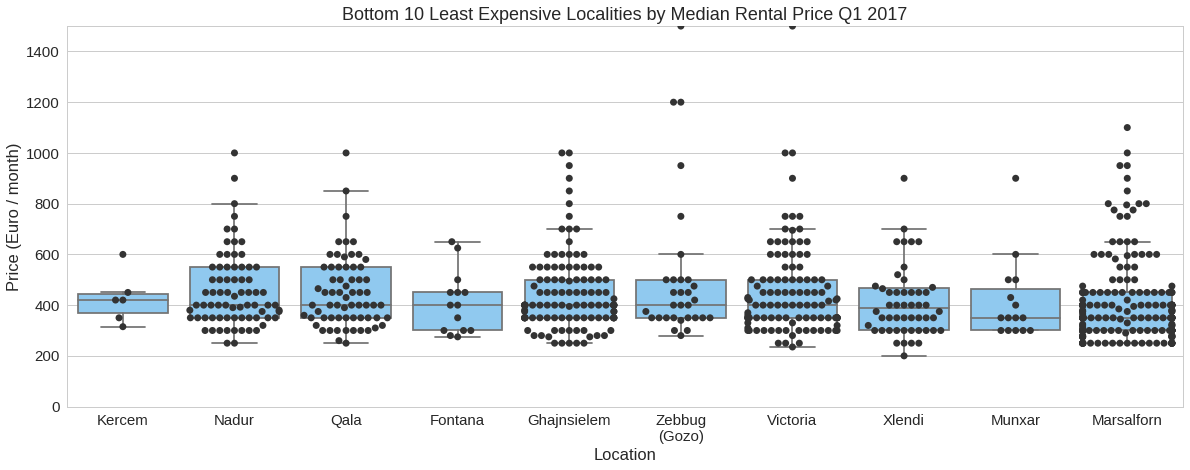
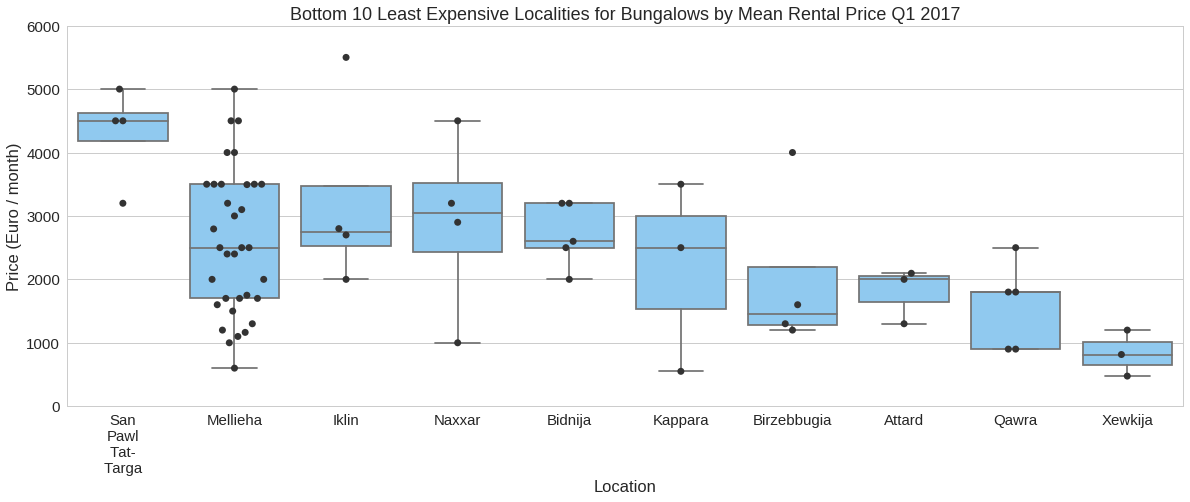
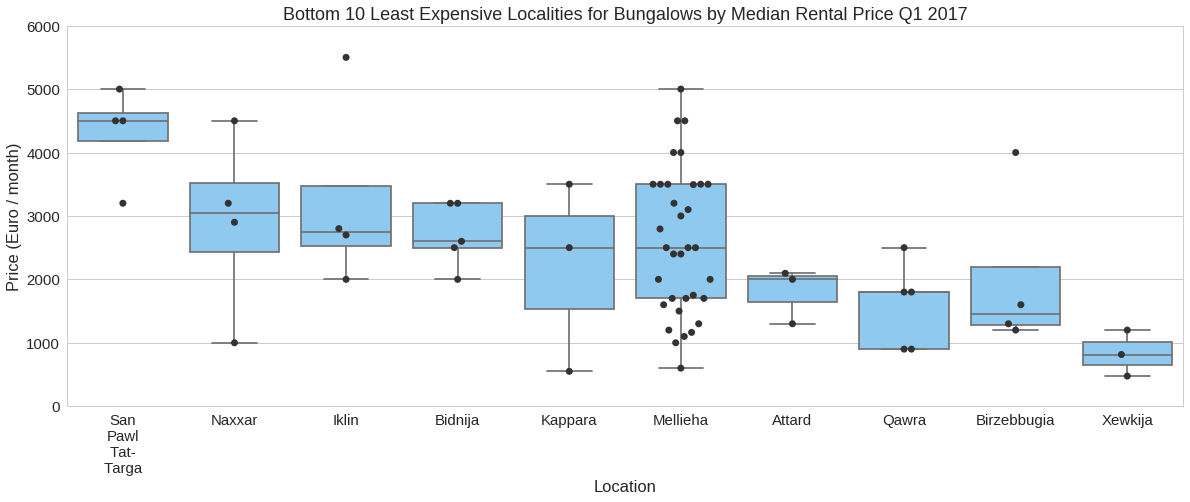
Least Expensive Localities for Bungalows as of Q1 2017
plot_n_towns(top=False, property_type='bungalow', y_max_lim=6000)
Tables
Price Changes per Property Type - Q1 2017 vs Q4 2016
plot_mmppc_by_pt(display_charts=False, display_tables=True)
Mean price percentage change per property type
Median price percentage change per property type
Apartment Price Changes per Town - Q1 2017 vs Q4 2016
plot_mmppc_by_ptat('apartment', display_charts=False, display_tables=True)
apartment - Top 5 locations - Largest mean price percentage change
apartment - Bottom 5 locations - Smallest mean price percentage change
apartment - Top 5 locations - Largest median price percentage change
apartment - Bottom 5 locations - Smallest median price percentage change
Penthouse Price Changes per Town - Q1 2017 vs Q4 2016
plot_mmppc_by_ptat('penthouse', display_charts=False, display_tables=True)
penthouse - Top 5 locations - Largest mean price percentage change
penthouse - Bottom 5 locations - Smallest mean price percentage change
penthouse - Top 5 locations - Largest median price percentage change
penthouse - Bottom 5 locations - Smallest median price percentage change
Maisonette Price Changes per Town - Q1 2017 vs Q4 2016
plot_mmppc_by_ptat('maisonette', display_charts=False, display_tables=True)
maisonette - Top 5 locations - Largest mean price percentage change
maisonette - Bottom 5 locations - Smallest mean price percentage change
maisonette - Top 5 locations - Largest median price percentage change
maisonette - Bottom 5 locations - Smallest median price percentage change
Town House Price Changes per Town - Q1 2017 vs Q4 2016
plot_mmppc_by_ptat('town house', display_charts=False, display_tables=True)
town house - Top 5 locations - Largest mean price percentage change
town house - Bottom 5 locations - Smallest mean price percentage change
town house - Top 5 locations - Largest median price percentage change
town house - Bottom 5 locations - Smallest median price percentage change
Terraced House Price Changes per Town - Q1 2017 vs Q4 2016
plot_mmppc_by_ptat('terraced house', display_charts=False, display_tables=True)
terraced house - Top 5 locations - Largest mean price percentage change
terraced house - Bottom 5 locations - Smallest mean price percentage change
terraced house - Top 5 locations - Largest median price percentage change
terraced house - Bottom 5 locations - Smallest median price percentage change
Villa Price Changes per Town - Q1 2017 vs Q4 2016
plot_mmppc_by_ptat('villa', display_charts=False, display_tables=True)
villa - Top 5 locations - Largest mean price percentage change
villa - Bottom 5 locations - Smallest mean price percentage change
villa - Top 5 locations - Largest median price percentage change
villa - Bottom 5 locations - Smallest median price percentage change
Bungalow Price Changes per Town - Q1 2017 vs Q4 2016
plot_mmppc_by_ptat('bungalow', display_charts=False, display_tables=True)
bungalow - Top 5 locations - Largest mean price percentage change
bungalow - Bottom 5 locations - Smallest mean price percentage change
bungalow - Top 5 locations - Largest median price percentage change
bungalow - Bottom 5 locations - Smallest median price percentage change